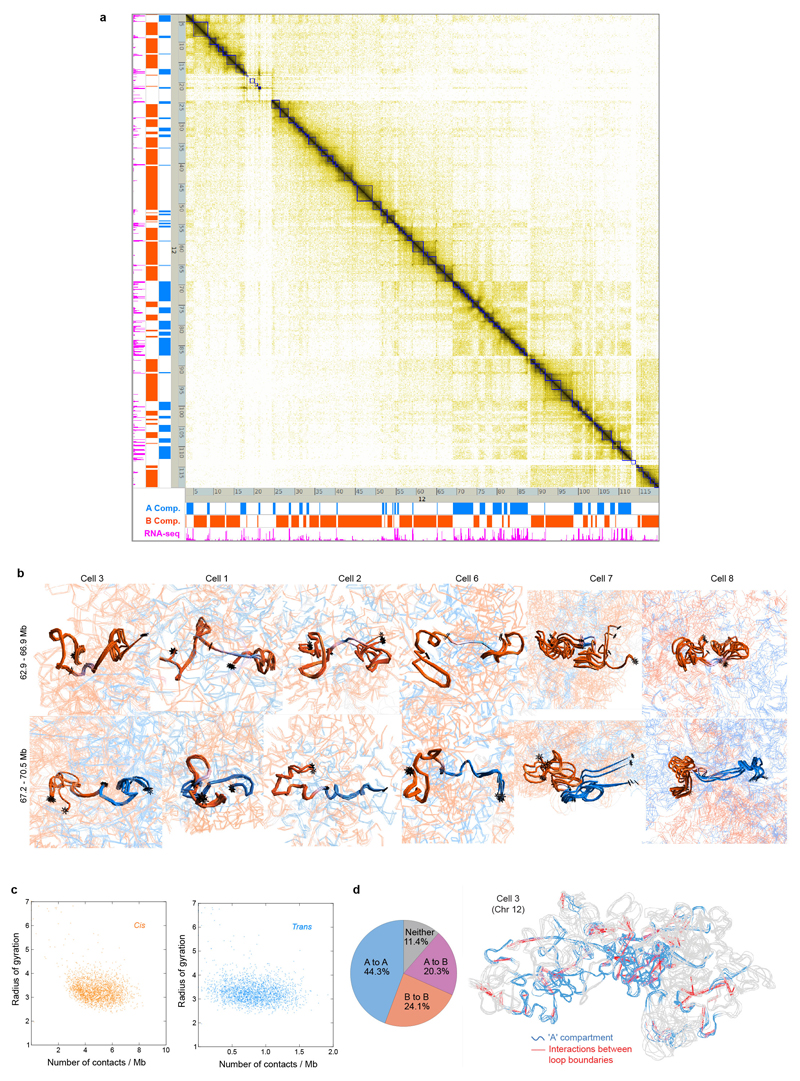
Extended Data Fig. 5. Chromosome folding into compartments, TADs and loops.
a, A contact map showing the population Hi-C data for chromosome 12 with TADs identified using the directionality index5 in blue. On the left hand side and below, data tracks are shown identifying the A and B compartments (in blue and red, respectively), and highly expressed genes (in magenta). b, Further comparisons (see Fig. 4b) showing the structures (and their variability) of two B compartment TADs either side of a highly expressed gene(s) in a short region of A compartment, or at a boundary between the A and B compartments (lower). Ensembles of five superimposed conformations, from repeat calculations using the same experimental data, are shown with pairs of TADs highlighted and coloured according to whether they are in the A or B compartments (blue and red, respectively), with white indicating a transitional segment (between A and B). TAD boundaries are marked by asterisks. c, Scatter plots of the mean radius of gyration for 1 Mb regions of genome structure compared to the average number of single-cell Hi-C contacts, within the same region, considering a 1 Mb sliding analysis window. Data is shown for all genome structures and split according to cis contacts (left) and trans contacts (right). d, Structure of Chromosome 12, with the A compartment coloured blue and positions of CTCF/Cohesin loops identified by Rao et al. (Ref. 7) indicated by dotted red lines. The pie chart shows the numbers of loops between sequences in the A and B compartments.

