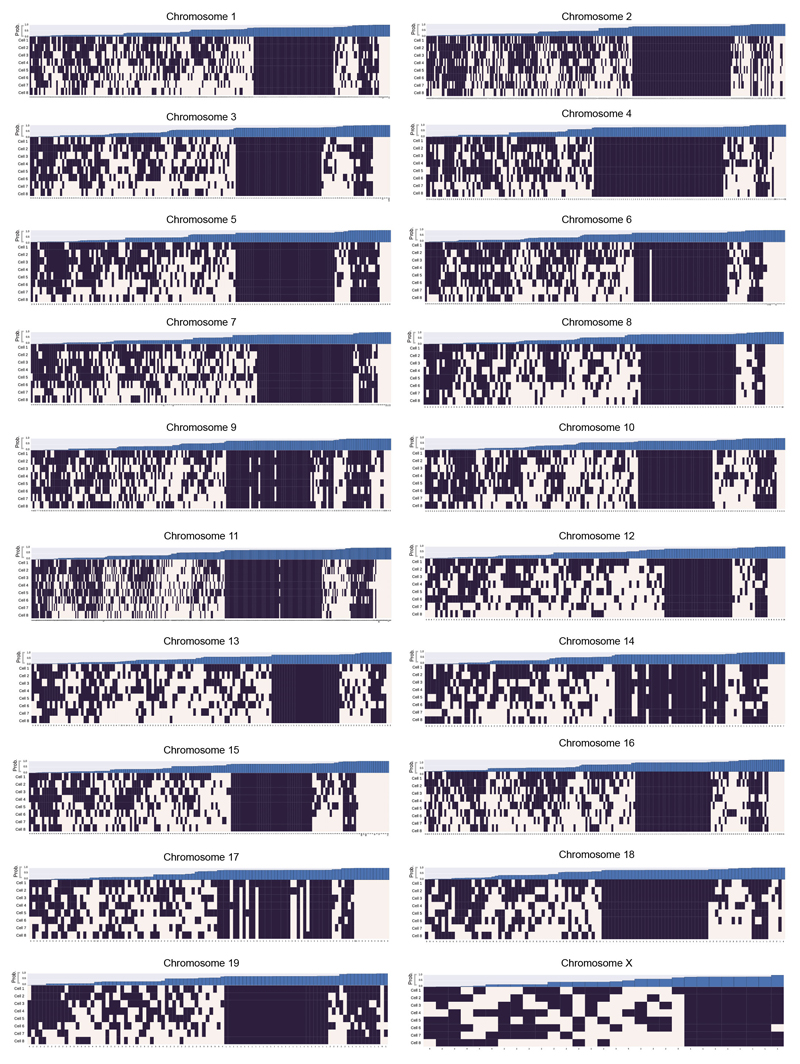
Extended Data Fig. 7. Chromosome folding into loops.
A genome-wide analysis illustrating whether CTCF/Cohesin loops7 could be formed in the different single cells, in each chromosome. A black square indicates that the two boundaries in the loop could interact, whilst a white square indicates that the two relevant particles are too far apart in the structure. The loop boundary separation, in particles, is shown along the x axis. The bar chart across the top shows the probability, for each loop, of random particles (pairs with the same sequence separation) forming the same number of contacts, or better. The probability of choosing a set of loop boundary points, which interact more frequently than we observed is 0.00072 (see Supplementary Methods).

