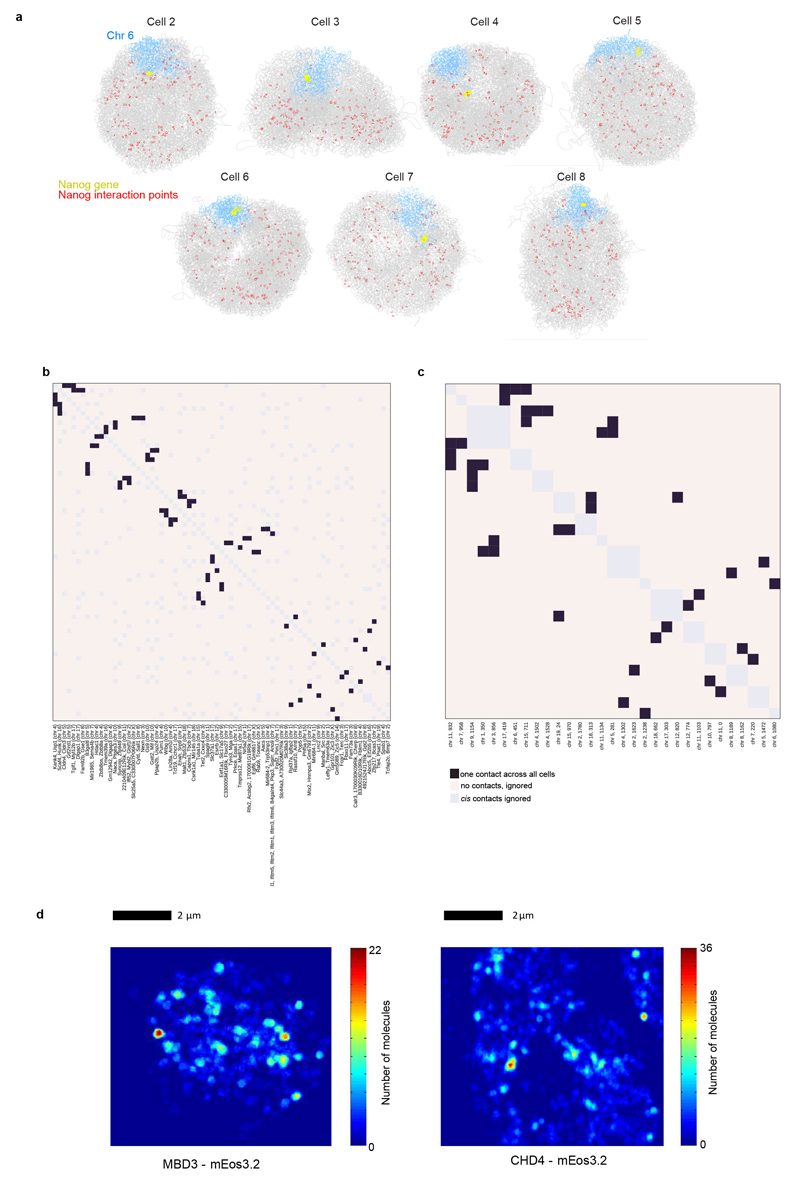
Extended Data Fig. 8. Understanding the nature of gene networks in mouse embryonic stem cells.
a, Structures of Cells 2-8 illustrating the interactions identified between the Nanog gene and other regions of the genome by population 4C (Ref. 34). Chromosome 6 is coloured in blue, with the position of the Nanog gene highlighted in yellow, whilst the remainder of the chromosomes are coloured grey. Interacting positions in the genome are indicated by red circles. b, Heat map showing the number of times a particular interaction is detected between two of the 4C Nanog-interacting points35. c, Heat map showing the number of times a particular interaction is detected between two of the 4C Pou5f1-interacting points36. In both b,c the interaction points are presented in hierarchical order grouping the regions that show the most interactions together. d, 2D single molecule tracking using photo-activated light microscopy (PALM) in live mESCs shows clustering of CHD4 and MBD3. In both cases, a heat map of a single cell is shown where the pixels have been colour-coded according to the density of molecules detected in that region.

