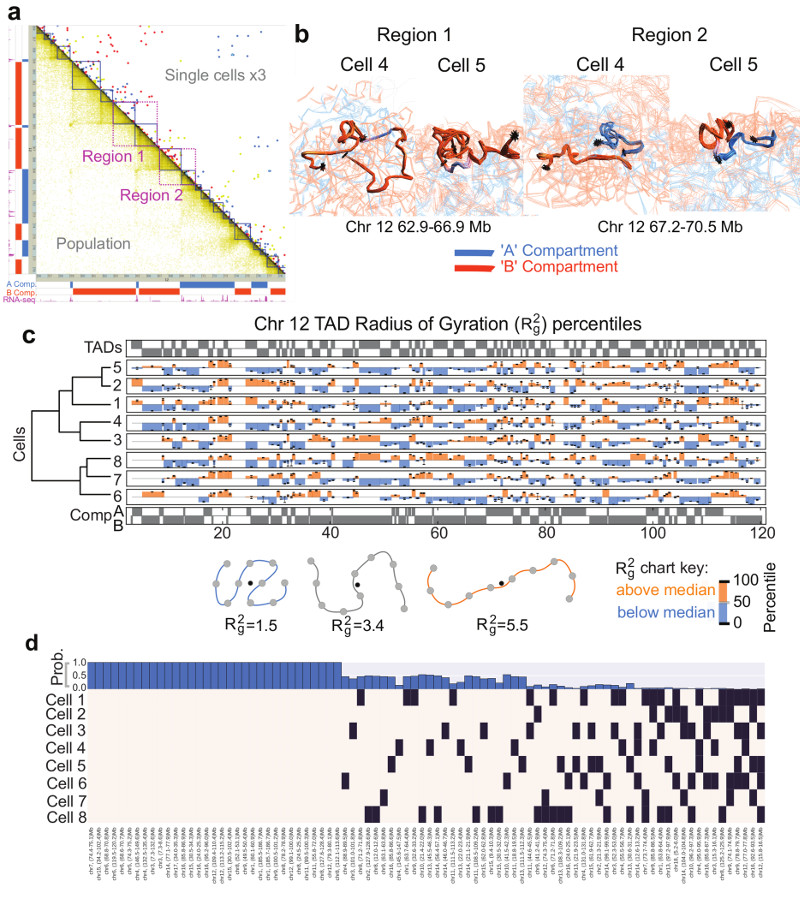
Fig. 4. Structure of topological-associated domains (TADs) and CTCF/Cohesin loops.
a, Part of the Hi-C contact map from Chromosome 12 showing: (above the diagonal) contacts observed in three different single cells (coloured red, yellow and blue); (below the diagonal) the corresponding population Hi-C data. TADs identified by Dixon et al. (Ref. 5) are shown in dark blue, and the two regions analysed in panel b are shown in magenta. b, Ensembles of five superimposed structures showing: (left) two B compartment TADs (Region 1 in a); (right) TADs either side of an A/B compartment boundary (Region 2 in a). The TADs are coloured according to whether they are in the A (blue) or B (red) compartments, with white indicating a transitional segment (between A and B). Boundaries are marked by asterisks. c, The mean radius of gyration (ROG) of Chromosome 12 TADs ± the standard error of the mean. The data are scaled according to TAD size, and presented as quantile values for the chromosome. Values below the 50th percentile value are colored blue and above it red. The ROG values for multiple cells are presented in hierarchical cluster order, grouping the most similar cell traces together. A schematic illustrating the calculation of the ROG as a measure of the compaction of a particle chain is shown below. d, Analysis illustrating whether CTCF/Cohesin loops with sequence separation >600 kb identified by Rao, et al. (Ref. 7) could be formed in the different single cells. A black square indicates that a loop could be formed, whilst a white square indicates that the two relevant particles are too far apart in the structure. The bar chart across the top shows the probability, for each loop, of random particles (pairs with the same sequence separation) forming the same number of contacts, or better.

