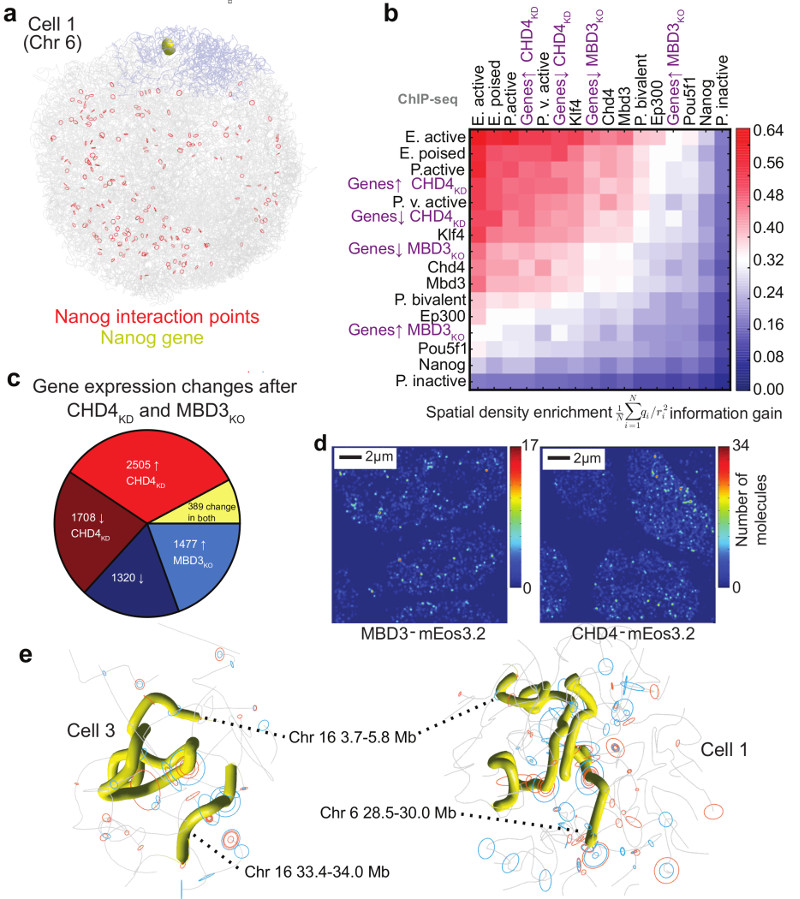
Fig. 5. Understanding the nature of gene networks in mouse ESCs.
a, Structure of an individual cell illustrating the interactions identified between the Nanog gene in Chromosome 6 (coloured yellow and blue, respectively) and other regions of the genome (red circles) in a population 4C experiment35. b, The spatial density enrichment of NuRD components (CHD4 and MBD3), pluripotency factors and NuRD regulated genes, as well as annotated enhancers and promoters defined using ChIP-seq data. c, Pie chart showing the numbers of NuRD regulated genes in different classes. d, A heat map showing clustering of CHD4 and MBD3 molecules in 2D super-resolution PALM in fixed mESCs. e, Structures of a region of chromosome 16 in two different cells, showing clustering of regions containing genes that are highly regulated by NuRD (highlighted in yellow). The positions of genes in either the CHD4-knockdown or MBD3-null cells that are down-regulated (red circles) or up-regulated (blue circles) are indicated by circles (larger for more highly regulated).

