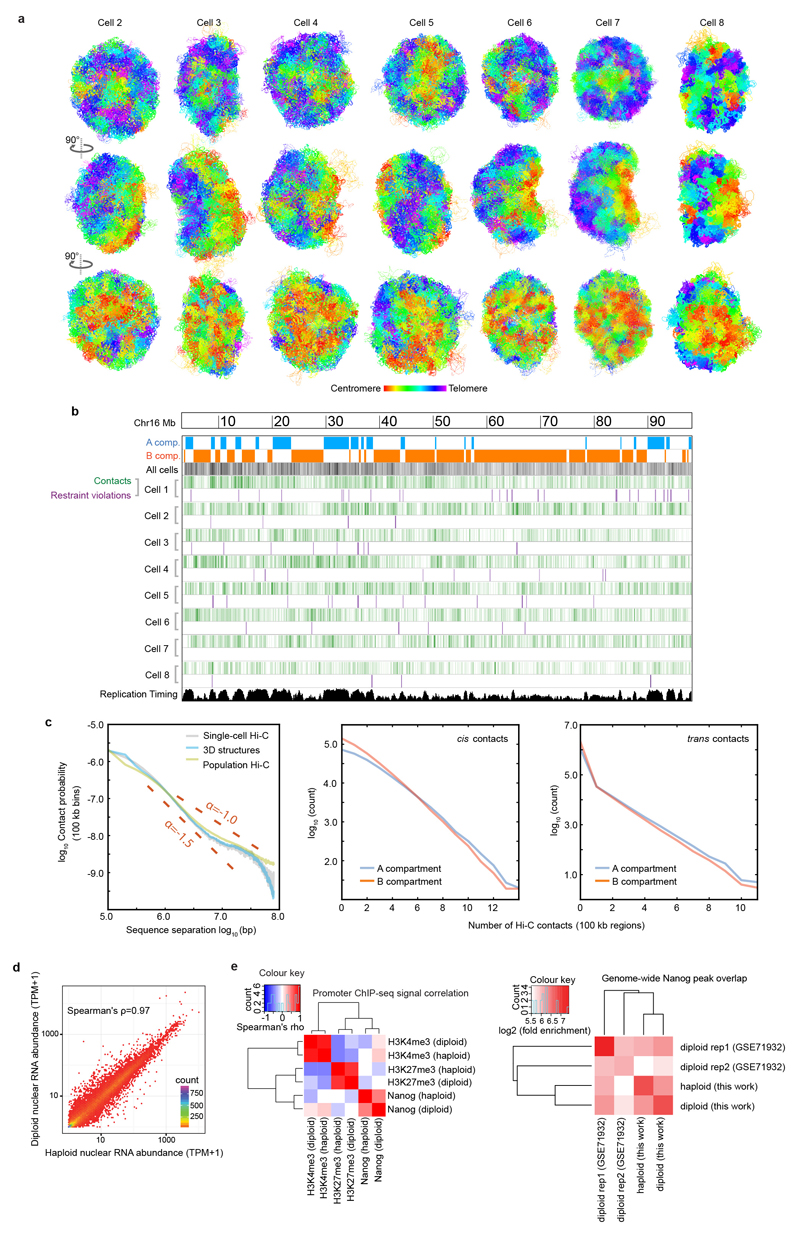
Extended Data Fig. 2. Validation and analysis of single cell contacts.
a, Structure of the entire haploid mESC genome from cells 2 to 8. The structural ensemble is represented by five superimposed conformations from repeat calculations, and is shown in three different orientations (after rotation through 90º relative to each other) with the chromosomes coloured according to their position in the chromosome sequence from red through to purple (centromere to telomere). b, Correspondence between the distribution of Hi-C contacts (both cis and trans), violations of the distance restraints in the 3D structures, and DNA replication timing13 for a representative chromosome (Chromosome 12). c, (left) Log scale plots of contact probability (Pcont) against sequence separation (S). The slopes for a power law relationship (Pcont ∝ Sα) where α is either -1.0 or -1.5 are also indicated. Data is shown for the combined single cell Hi-C contact data, for all of the non-sequential particles that are close to each other in the structures (<2 particle radii apart), and for the population Hi-C data. (right) The distribution in the number of intra- (cis) or inter-chromosomal (trans) contacts between 100 kb regions in the single-cell Hi-C data is shown for both the A and B compartments. d, Correlation of gene expression levels (left), and hierarchically clustered heat maps showing the pairwise enrichment of ChIP-seq peak overlaps between haploid and diploid mES cells (centre), and between Nanog ChIP-seq peak overlaps between haploid and diploid ES cells used in this study, as well as that previously published from diploid ES cells (right)41.

