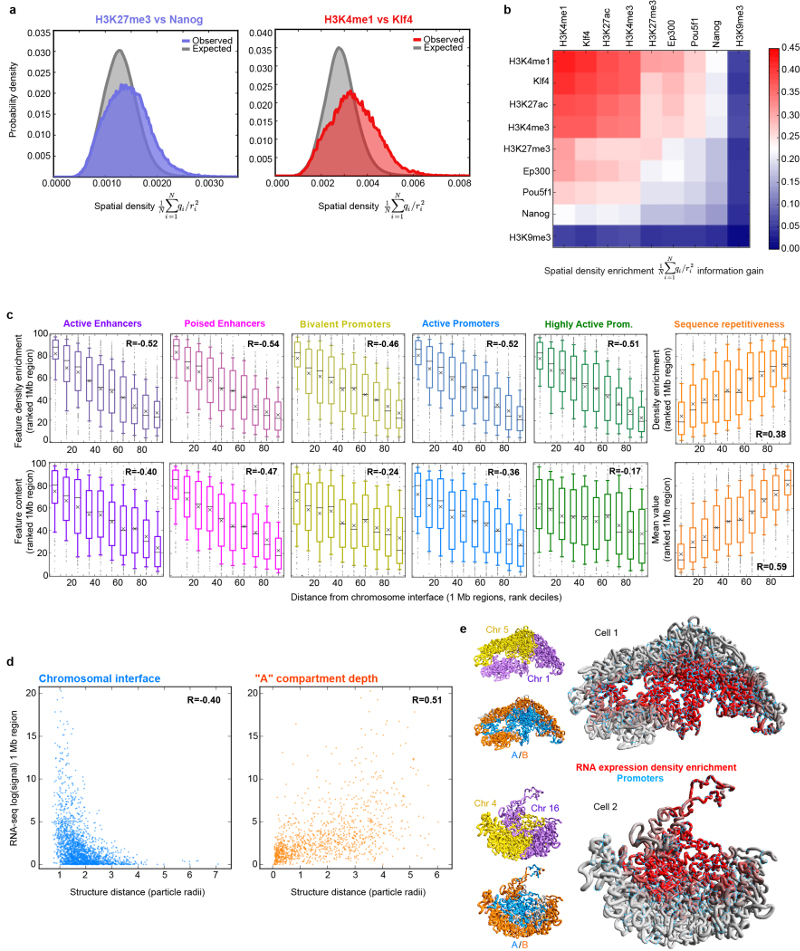
Extended Data Fig. 4. Relationship between genome folding and gene expression.
a, Calculation of 3D spatial clustering compared to a random hypothesis where the same data were circularly permuted around the sequence, and repeating the calculations, using the same structure. Two examples, showing strong (Klf4/H3K4me1) and weaker (Nanog/H3K27me3) spatial co-localisation, compared to random, are shown. b, The enrichment in spatial density (after removal of any clustering expected from their being located nearby in the same chromosome sequence), of histone H3 with various post-translational modifications and selected pluripotency factors as determined using ChIP-seq data. The enrichment is calculated over all cells as the Kullback-Liebler divergence of the normalized spatial density distribution from a random, circularly permuted, expectation (see Supplementary Methods for more details), and the data are presented in hierarchical order, grouping the most similar datasets together. c, Box and whisker plots showing enhancer, promoter and repetitive sequence content (lower row), and the enrichment in spatial density of different types of enhancer, promoter and repetitive sequence (upper row), after the data have been divided into ten groups based on increasing distance from the nearest inter-chromosomal interface. The whiskers represent the 10th and 90th percentiles, the boxes represent the range from the 25th to 75th percentile, and outliers are shown as dots. Mean and median values are shown with black crosses and bars, respectively. The R-values are the Pearson’s correlation coefficient on the underlying, unranked data. d, Plots of the level of gene expression as measured by the nuclear RNA-seq signal within 1 Mb regions against distance from the nearest inter-chromosomal interface (left) and the outer surface of the A compartment (right). e, Examples of inter-chromosomal interfaces from two different cells where the chromosomes are coloured increasingly brightly red for higher enrichment in the density of gene expression, compared to what would be expected for a given sequence separation. The remainder of the two chromosomes is coloured grey, and the positions of promoters are indicated by blue circles. The same views are shown with the two different chromosomes coloured yellow and blue (upper), or with their regions in the A and B compartments coloured blue and red (lower).

