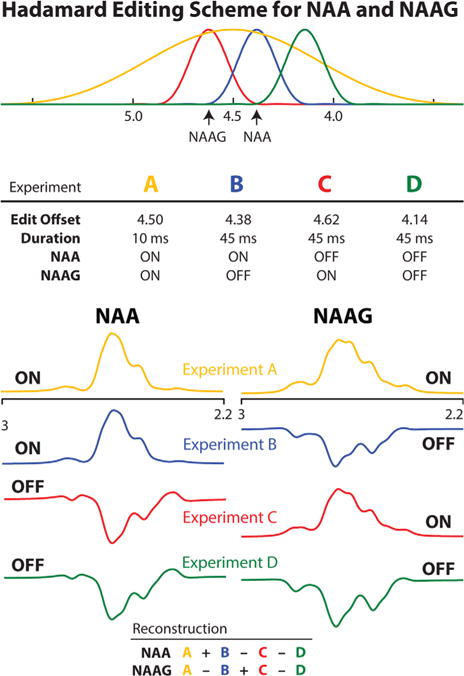
Fig. 3.

Schematic diagram of the HERMES editing scheme for NAA and NAAG. Four experiments are acquired with editing pulse offsets and durations, as specified in the top table. The inversion envelopes of the editing pulses are plotted above the top table and color-coded by experiment. The table at the bottom shows the Hadamard combinations that correspond to the difference-edited spectra for NAA and NAAG.
