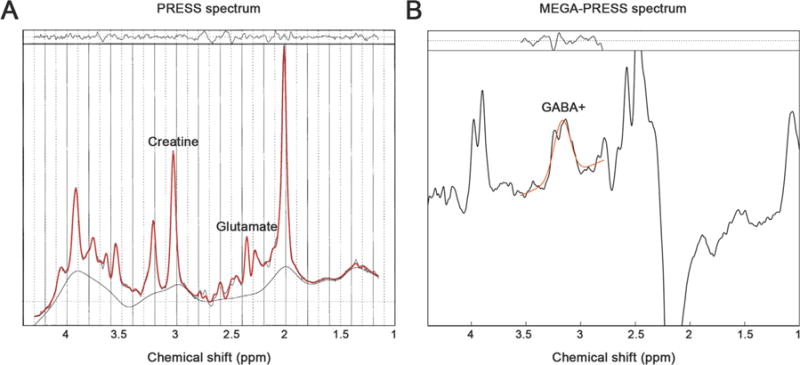
Fig. 2.

Plots of the (a) Point resolved spectroscopy (PRESS) spectrum, where the Cr and Glu peaks are indicated and (b) Mescher-Garwood point resolved spectroscopy (MEGA-PRESS) edited difference spectrum, where the GABA+ peak is indicated. In both cases the red line is a fit of the data and the residuals of this fit are shown in the top of both plots. (For interpretation of the references to color in this figure legend, the reader is referred to the web version of this article.)
