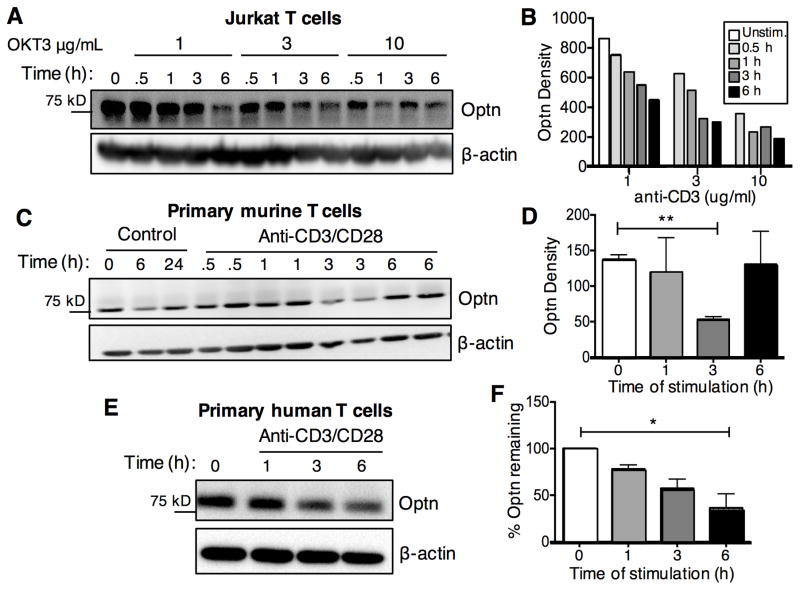
Fig. 4.
Rapid turnover of Optn protein after TCR-induced T cell activation.
Jurkat T cells (A), CD4+ T cells from C57BL/6 mice (C) or primary human CD3+ T cells (E) were stimulated with anti-CD3/CD28 Abs. After the indicated time points cells were harvested and cell lysates were obtained, followed by western blot analysis for Optn and β-actin protein. Panels B, D and F depict quantitative analysis of Optn protein levels following stimulation, from one experiment (A–B) or at least three experiments (C–F). Human T cells were purified from the PBMC of three individual healthy adult donors, with data summarized in panel F, a representative example of which is shown in panel E.

