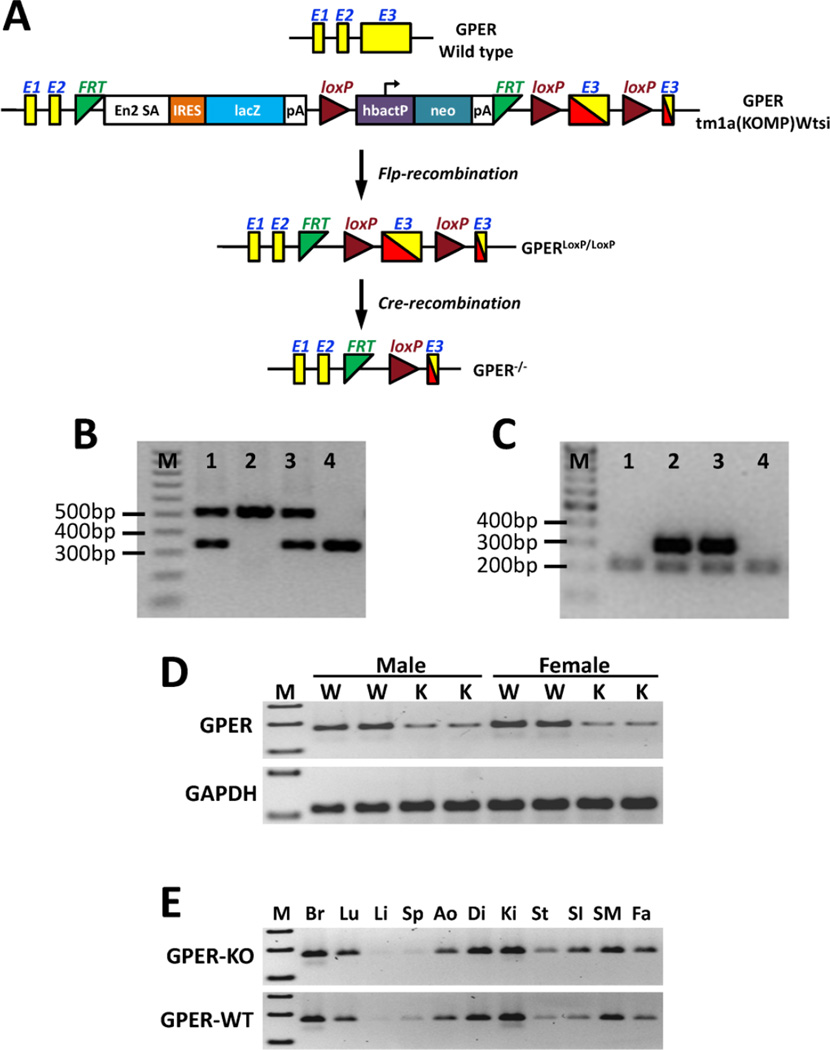
Figure 1.
Development of the cardiomyocyte-specific GPER KO mouse. (A) Targeting strategy for the conditional disruption of the GPER gene. (B) A representative image showing genotyping results for the floxed GPER transgene from mouse tails. Sample 2: 530 bp band, homozygous floxed GPER transgene (GPERf/f); Sample 4: 345 bp band, WT GPER; Samples 1 and 3: 530 bp and 345 bp bands, heterozygous floxed GPER transgene. (C) A representative image showing genotyping results for the Cre transgenic mice. Samples 2 and 3: 300 bp band, Cre positive; Samples 1 and 4: 200 bp band, Cre negative (internal positive control for PCR). (D) RT-PCR results showing knockdown of GPER expression in cardiomyocytes isolated from adult (8 weeks old) GPERf/f/Cre mice (knockout, K) compared with GPERf/f mice (W). (E) RT-PCR results showing GPER expression in various tissues from GPERf/f/Cre (knockout, KO) vs. GPERf/f (WT) mice. M: marker; Br: brain; Lu: lung; Li: liver; Sp: spleen; Ao: aorta; Di: diaphragm; Ki: kidney; St: stomach; SI: small intestine; SM: skeletal muscle; Fa: fat.

