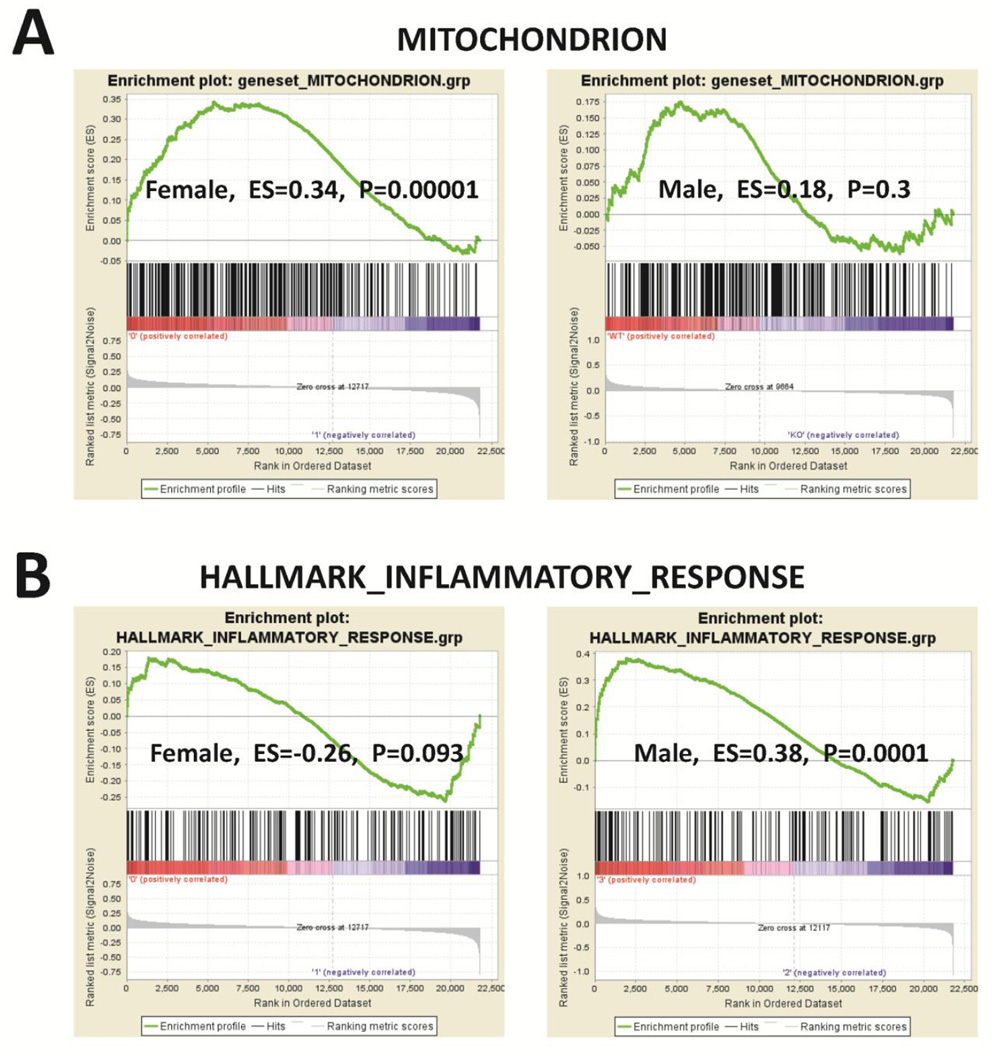
Figure 4.
GSEA analysis for the enrichment of “MITOCHONDRION (including 314 genes)” and “HALLMARK_INFLAMMATORY_RESPONSE (including 193 genes)” gene sets in cardiomyocyte-specific GPER KO vs. WT (GPER intact) cardiomyocytes. The bar-code plot indicates the positions of genes in each gene set; red and blue colors represent positive and negative Pearson correlations with GPER expression, respectively. The results show that mitochondrial genes were enriched in GPER KO vs. WT cardiomyocytes from female, but not male, mice. Inflammatory response genes were enriched in GPER KO vs. WT cardiomyocytes from male, but not female, mice. ES: enrichment score.

