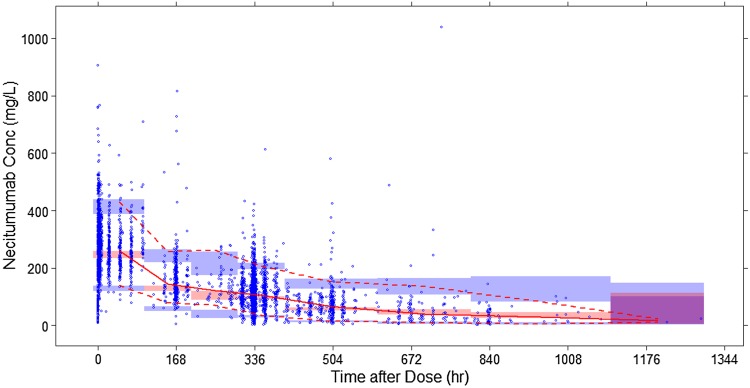
Fig. 4.
Prediction-corrected visual predictive check of the final pharmacokinetic model. Blue circles are observed data. The solid line depicts median observed data, while the pink shaded area defines the prediction interval around the median. The dashed line depicts the observed 5th and 95th percentiles, while the blue shaded area defines the prediction interval of the same

