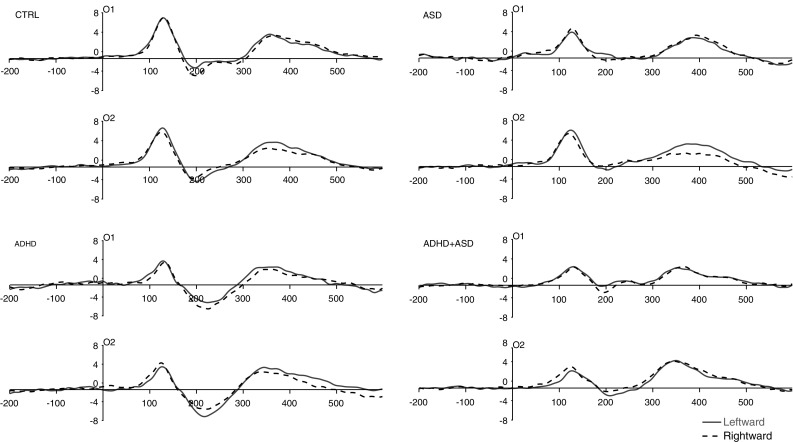
Fig. 2.

Each plot shows ERP waveforms for the chevron cue at electrodes O1 (left occipital hemisphere) and O2 (right occipital hemisphere) for leftward (solid line) and rightward (dashed line) cue trials in each group. Time is shown on the x-axis in milliseconds. Amplitude is shown on the y-axis in microvolts. Stimulus-onset is shown at time ‘0’
