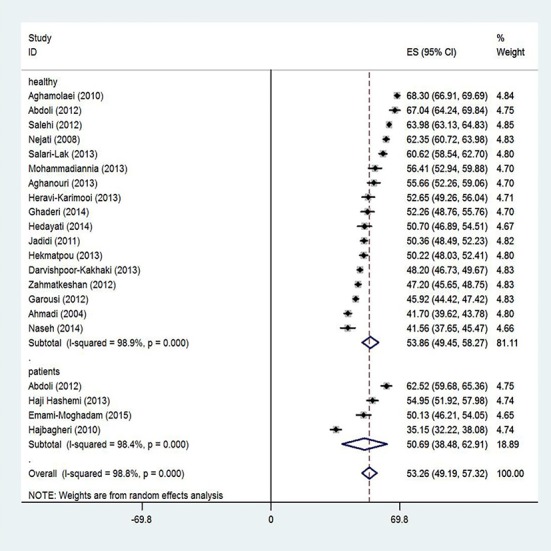
Figure4.

The mean score of QoL based on the place of the study; CI of 95% of each article is represented as horizontal lines near the main mean line; dashed line at the mid represents an estimate of the total mean score; and the rhomboid represents CI of the mean score of QoL.
