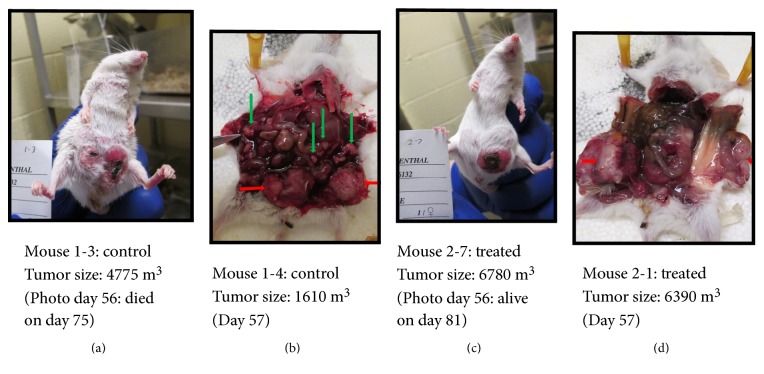
Figure 5.
Appearance of representative mice from the J-HER treatment trial described in Figure 4. TUBO cell tumor development is shown for different control and J-HER-immunized mice. (a) Control, day 56, tumor size: 4775 m3, died on day 75. (b) Control, day 57, tumor size: 1610 m3. (c) Treated, day 56, tumor size: 6780 m3, survived the trial. (d) Treated, day 57, tumor size: 6390 m3. Red arrows indicate tumors at the site of implantation. Green arrows represent nodular tumors that spread within the abdomen.

