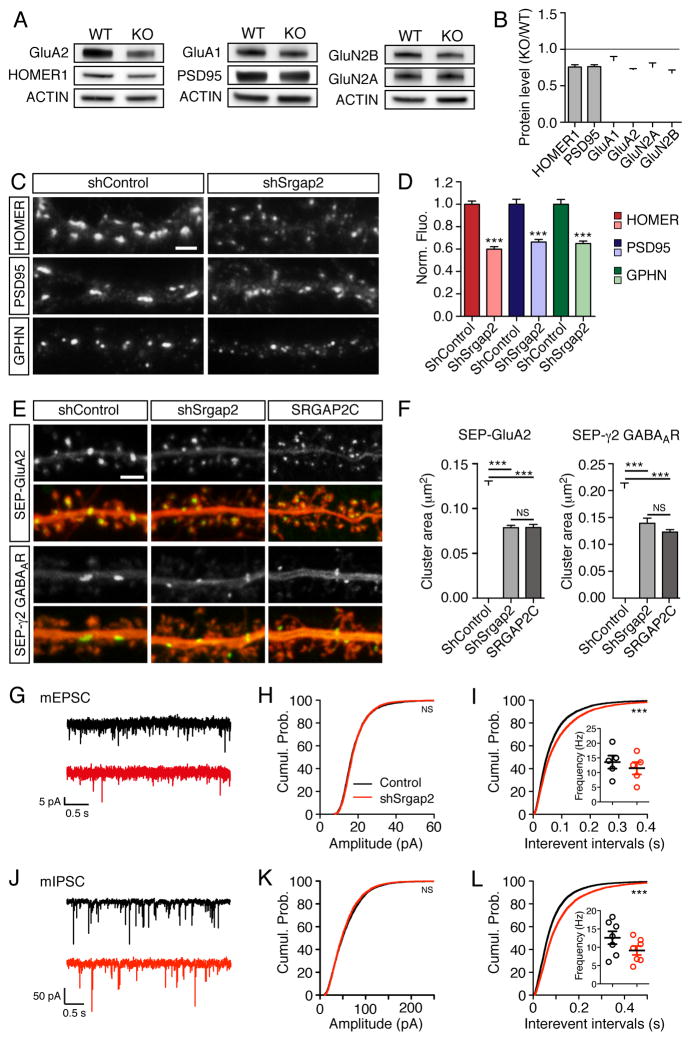
Figure 6. SRGAP2A regulates the assembly of excitatory and inhibitory postsynaptic scaffolds.
(A–B) Representative Western blots (A) and quantifications
(B) of the synaptic abundance of the indicated proteins in P15 wild-type (WT) and Srgap2a KO brains (n=4).
(C) Immunofluorescence of endogenous proteins in cortical neurons cultured for 17–18 days in control condition (shControl) or after Srgap2a knock-down (shSrgap2). Scale bar 2 μm.
(D) Normalized fluorescence intensity (Norm. Fluo.) associated with clusters of the indicated proteins in shControl and shSrgap2 conditions (n=40–42 cells).
(E) Live imaging of SEP-GluA2 and SEP-γ2 GABAA receptors in control pyramidal neurons, after Srgap2a knock-kown or after SRGAP2C expression (20–22 days in vitro). Scale bar: 2 μm.
(F) Mean receptor cluster size in the conditions described above. SEP-GluA2: nshControl = 34, nshSrgap2 = 35, nSRGAP2C = 32 ; SEP-γ2: nshControl = 36, nshSrgap2 = 25, nSRGAP2C = 35. Mean ± SEM.
(G) Representative traces of mEPSCs in control (black) and shSrgap2-electroporated (red) neurons.
(H–I) Quantification of mEPSC amplitude (nControl = 2883 from 5 cells, nshSrgap2 = 2811 from 5 cells) and interevent intervals (nControl = 7232, nshSrgap2 = 6587). Cumul. Prob.: cumulative probability. Inset indicates the mean frequency per cell.
(J) Representative traces of mIPSCs in control (black) and shSrgap2-electroporated (red) neurons.
(K–L) Quantification of mIPSC amplitude (nControl = 4370 from 7 cells, nshSrgap2 = 4125 from 7 cells) and interevent intervals (nControl = 11520, nshSrgap2 = 8262). Inset indicates the mean frequency per cell.
*** p < 0.001, NS: p > 0.05, Mann-Whitney test or Kruskal-Wallis test followed by Dunn’s multiple comparison test (panel F).

