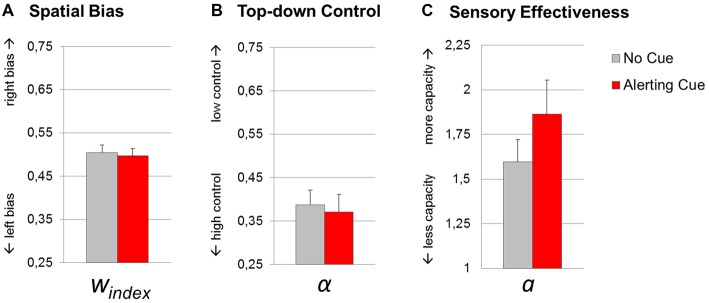
Figure 4.
Theory of visual attention (TVA) parameter estimates resulting from fittings of trials with (red bars) and without (gray bars) an alerting cue. Group mean values of parameters spatial bias windex (A), top-down control α (B) and sensory effectiveness a (C). Error bars indicate standard errors of the mean.

