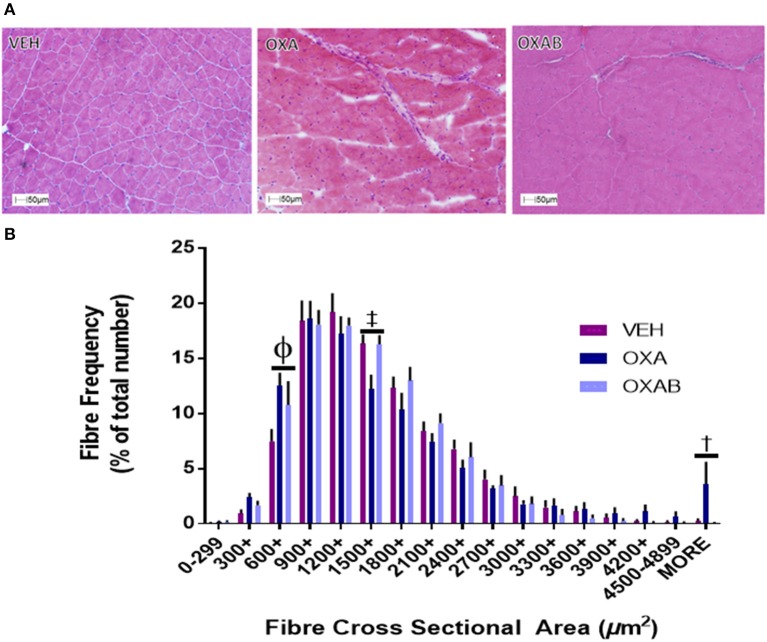
Figure 4.
OXA and BGP-15 treatment effect fiber size distribution in TA muscle. (A) Representative images of H&E stained TA and fiber size frequency histogram (B) OXA treatment significantly increased the frequency of fibers in the 600-899 μm2 and >4,900 μm2 size bins whilst reducing the frequency of fibers in the 1,500–1,799 μm2 size bin. Significance: Φp < 0.0005 VEH compared to OXA and p < 0.05 VEH from OXAB; ‡p < 0.005 VEH and OXAB compared to OXA, †p < 0.05 OXA and OXAB compared to VEH. n = 4.

