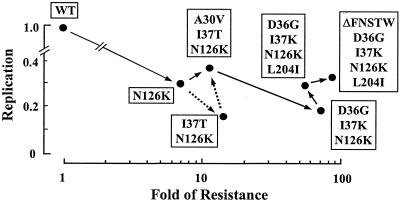
FIG. 2.
Replication kinetics of the resistant variants. The replication kinetics determined by p24 antigen production and the CHRA are summarized. The data are depicted as the resistance (x axis) and replication (y axis) compared with those of HIV-1WT. Variants observed (continuous arrows) and not observed (dashed arrows) in the selection are shown in the order of their emergence.

