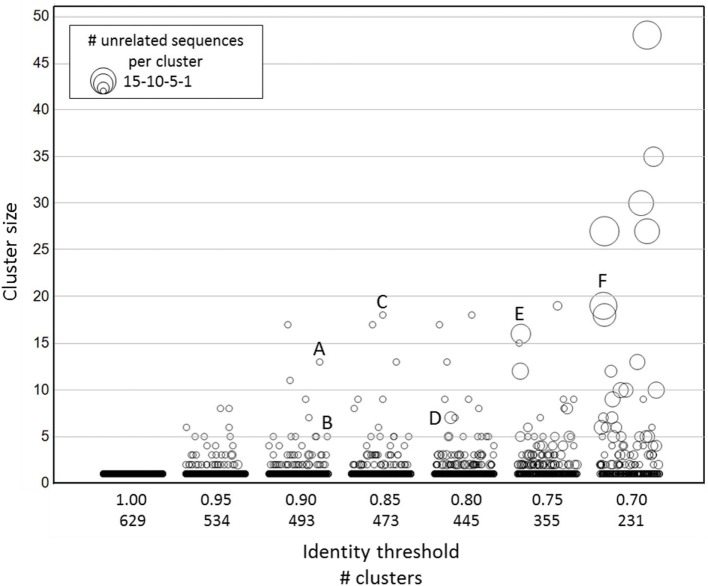
Figure 2.
Clustering of publicly available nanobody sequences. On the x-axis, the different CD-HIT clustering exercises at various sequence identity thresholds are shown, including the number of clusters at a given threshold. The y-axis (cluster size) displays the sequence counts per cluster. The symbol size indicates the number of unrelated nanobody sequences. The identities of the sequences in each cluster are given in Table S1 in Supplementary Material. The alignments of the sequences captured in clusters identified by a capital letter are shown in Figure S1 in Supplementary Material.

