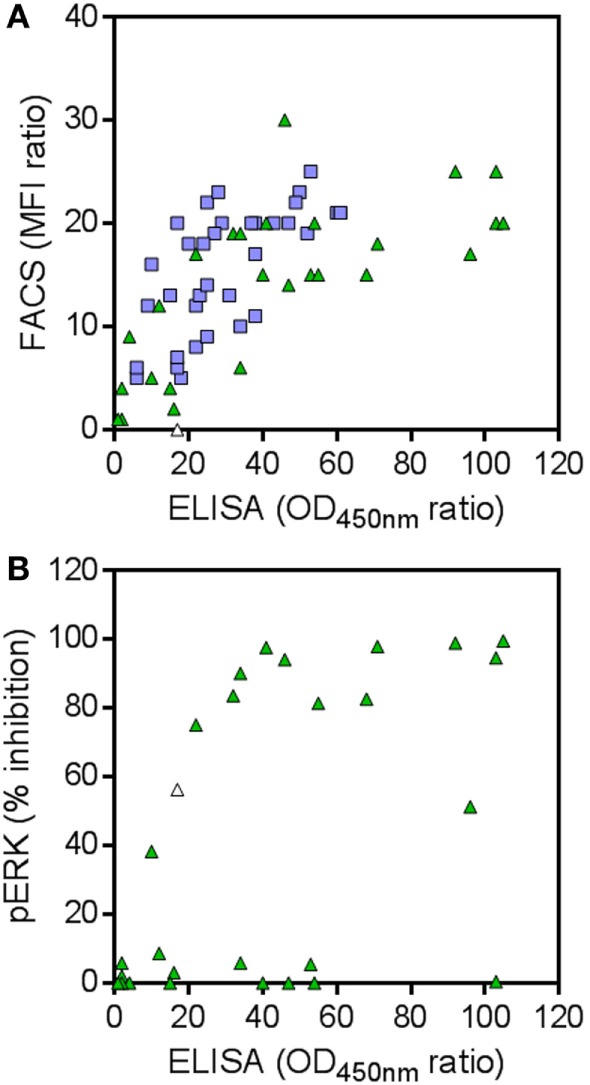
Figure 4.

(A) Binding to human RON (hRON) of candidate binders. Shown are the selective binding ratios of ELISA and FACS experiments. (B) Inhibition of ligand-induced ERK phosphorylation by candidate binders. Shown are the % inhibition of ERK phosphorylation and the selective binding ratios of the ELISA experiment. Green triangles represent 28 randomly selected candidate hRON-binding nanobodies, predicted by the next-generation sequencing (NGS) analysis. Blue squares represent 35 hRON-binding nanobodies, predicted by the NGS analysis and identified in the conventional screening campaign. The white triangle represents nanobody NGS00009 which was not analyzed in the FACS experiment (see Table S2 in Supplementary Material) and as such was given a selective binding ratio of 0, but scored positive in the ELISA and pERK assays.
