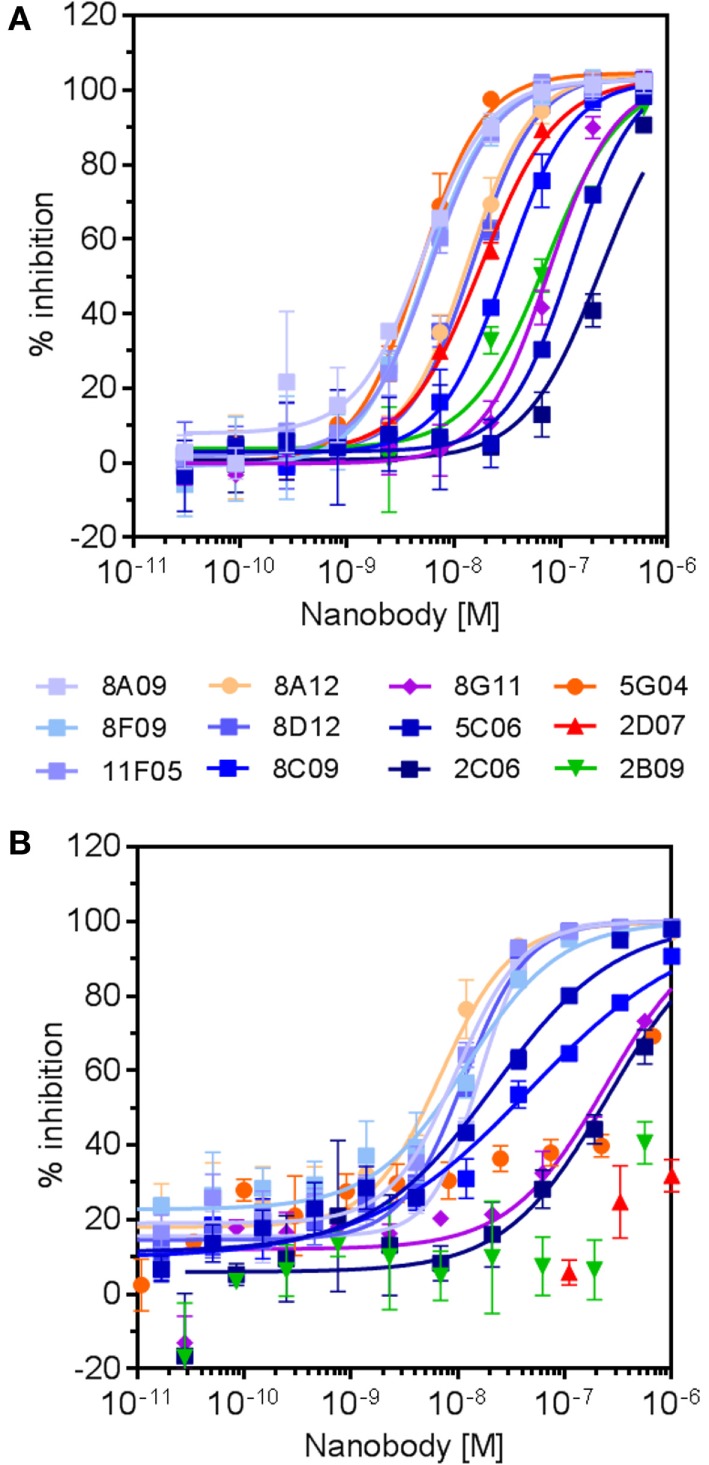
Figure 6.

Dose–response curves of selected anti-human RON (hRON) nanobodies inhibiting ligand-induced ERK phosphorylation (A) and binding of ligand to hRON (B). Symbol colors relate to the different epitope bins to which the nanobodies belong (Table 3): bin A (shades of blue), bin B (purple), bin C (green), bin D (red), and bin C–D (shades of orange).
