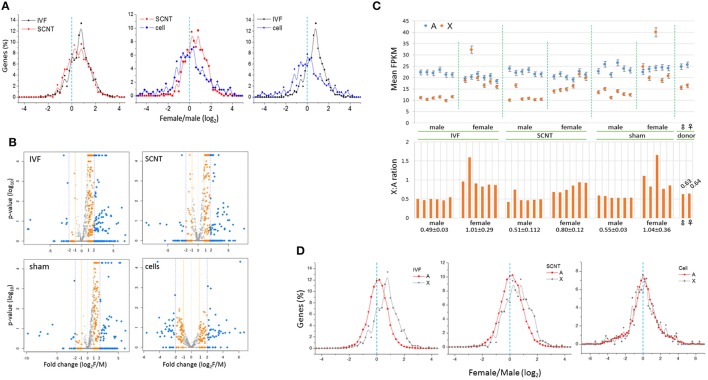
Figure 3.
Distribution of female-to-male ratios of X-chromosome gene expression levels in bovine blastocysts. (A) Distribution of female-to-male (F:M) ratios of expression levels of X-chromosome genes (X-linked genes) in bovine IVF (black) and SCNT (red) blastocysts, and donor cells (blue). The dotted line (cyan) denotes an F:M ratio of 1 [log2(F:M) ratio = 0]. Bin size, 0.2 in log2(FPKM). (B) Volcano plots showing mean F:M levels of individual X-linked genes against p-values and fold changes in each blastocyst group. Genes with different F:M fold changes are denoted in different colors. (C) Comparison of expression (mean FPKM ± STD) in autosomal (A, blue) and X-chromosome genes (X, orange) between males and females in IVF, SCNT, and sham-NT blastocysts. The X:A ratio that denotes the FPKM level in each blastocyst is provided in the lower panel; the mean X:A ratios (± STD) of individual groups are denoted below. Donor cells are included for reference. (D) Distribution of female-to-male ratios in autosomal (A, black) and X-chromosome genes (X, red) in IVF and SCNT blastocysts. A dotted line (cyan) denotes an F:M ratio of 1 [log2(F:M) ratio = 0]. Bin size, 0.2 in log2(FPKM). Donor cell samples are included for reference.

