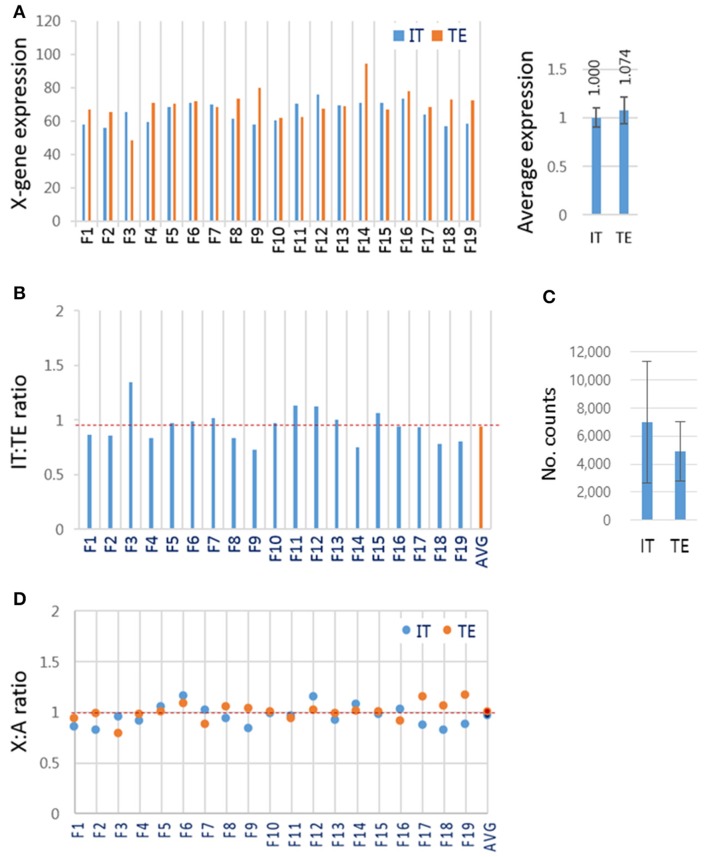
Figure 5.
X-chromosome gene expression in inner cell mass and trophectoderm lineage cells of female IVF blastocysts. (A) The mean expression levels of X-linked genes in different lineage cells of the blastocyst. Female IVF blastocyst was physically split using a syringe needle into the “IT” part containing both ICM and TE cells and the TE-only part and separately subjected to RNA-seq. Right panel, the mean expression levels of X-linked genes in the IT and TE cells. (B) The relative expression of X-linked genes in IT to that in TE part in each blastocyst. (C) The mean XIST expression levels in read counts. Error bars, standard deviations. (D) The mean X:A ratios in IT (blue) and TE (red) cells. AVG, average IT/TE ratio (see also dotted red line).

