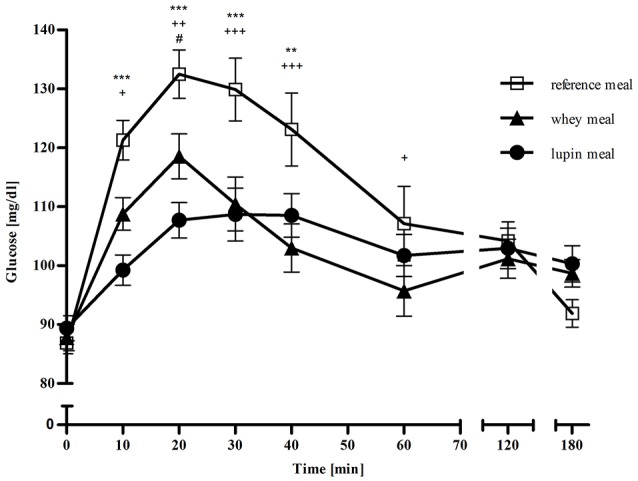
Figure 2.

Mean (± SEM) of blood glucose concentrations in mg/dl over 180 min following the three different meals: □ representing the reference meal, ▴ representing the meal supplemented with whey, • representing the meal supplemented with lupin, * representing differences between the lupin and the reference meal, + representing differences between the whey and the reference meal and # representing differences between the lupin and the whey meal. ***/+++/###p < 0.001; **/++/##p = 0.001–0.01; */+/#p > 0.01–0.05.
