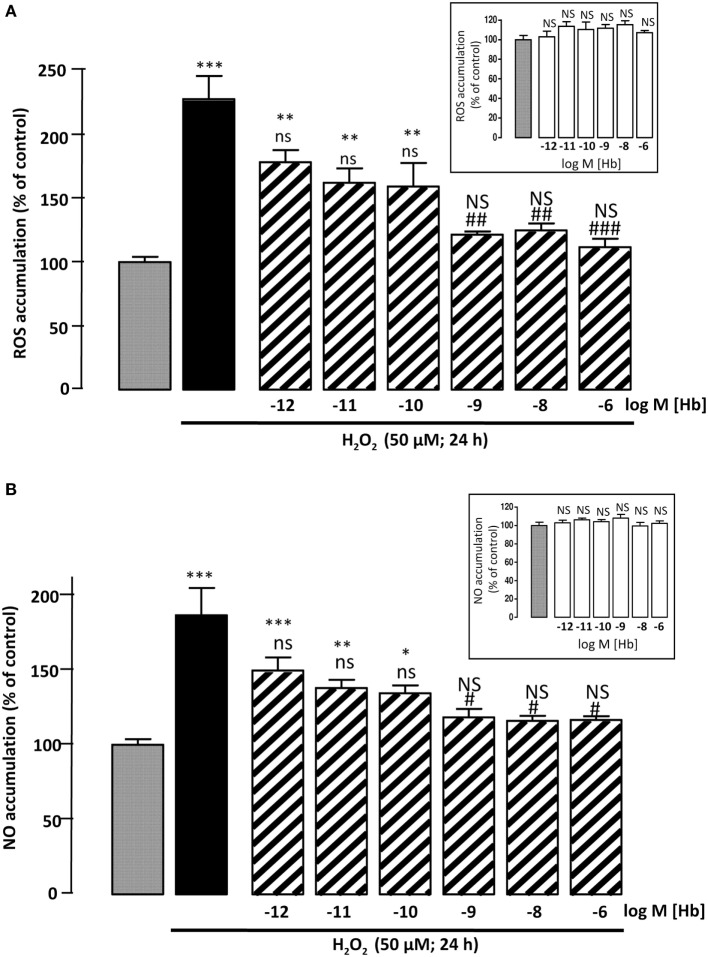
Figure 2.
Effect of Hb on H2O2-induced ROS and NO intracellular accumulations. Cells were co-incubated for 24 h with medium alone ( ) or with H2O2 (50 µM) in the absence (
 ) or presence of graded concentration of Hb (10−12 to 10−6 M,
  ). (A) Cellular ROS level was quantified by measurement of DCF fluorescence intensity. (B) Cellular NO level was quantified by measurement of DAF fluorescence intensity. Inset, effect of graded concentration of Hb (10−12 to 10−6 M;
  ) on intracellular ROS accumulation (A) and NO formation (B). The results are expressed as percentages of the controls. Data are means ±SEM of three independent experiments. ANOVA followed by Bonferroni’s test *p < 0.05; **p < 0.01; ***p < 0.001; NS, not statistically different from control cells. #p < 0.05; ##p < 0.01; ###p < 0.001; ns, not statistically different vs. H2O2-treated cells.

