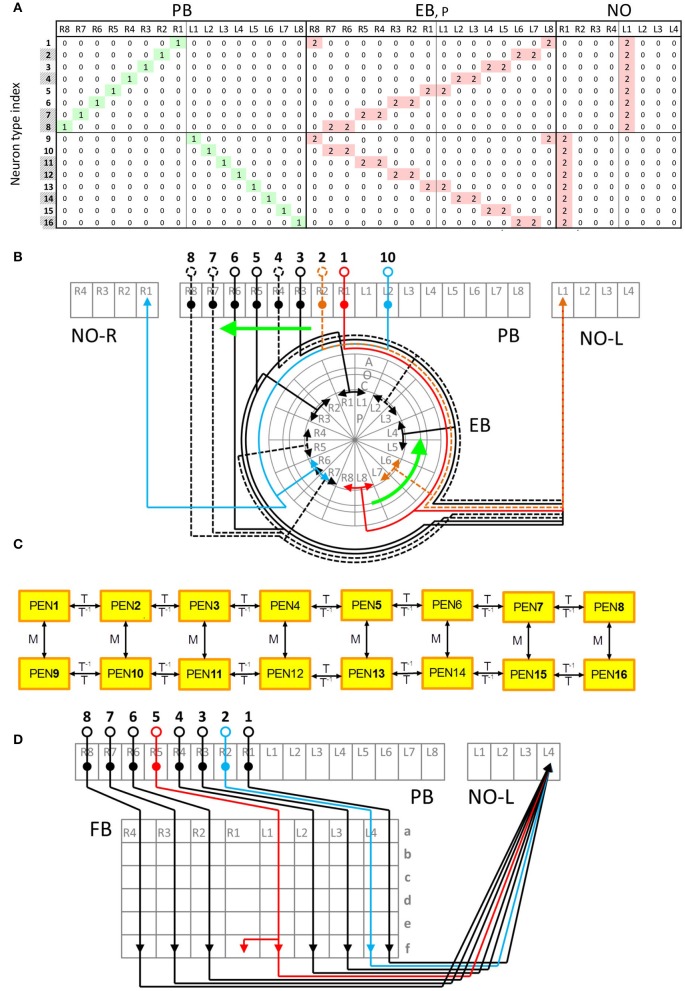
Figure 2.
Typical and atypical innervation patterns of neurons in the central complex. (A) The innervation table for the PEN class. Each row represents the innervation vector of a given PEN neuron type while each column indicates how a subunit is innervated by different neuron types (0 for no innervation, 1 for dendrite and 2 for axon). Shaded neuron type indices indicate the types that were not observed but predicted in Lin C.-Y. et al. (2013). This neuron class demonstrates a typical (or regular) innervation pattern. (B) The innervation diagram of the PEN class. Neuron types are labeled by black numbers and the subunits are in gray. The relationship between the neuron types PEN1-PEN8 (numbers 1-8) can be described as shifting. The same relationship is observed for PEN9-PEN16. In addition, PEN9-PEN16 are a mirroring of PEN1-PEN8, respectively. The arrowheads represent axons while the solid circles indicate dendrites. The somas are represented by the empty circles. Dashed lines are neurons predicted in Lin C.-Y. et al. (2013). (C) A generator diagram of the PEN class showing how generators can be used to produce one neuron type from others. The PEN class demonstrates a regular (or typical) innervation pattern with which all neuron types can be generated from one initial neuron by recursive application of T or M generators. The rightward arrows indicate the effect of the generators labeled above the arrows while the leftward arrows is for the generators labeled below. (D) Atypical innervation patterns of the PFN-FfN4 class. The type 2 neuron does not make a shift with respect to the type 1 as expected, but innervates the same FB unit (FBf-L4) as type 1. The type 5 neuron innervates two adjacent FB subunits while other neurons only innervate one.

