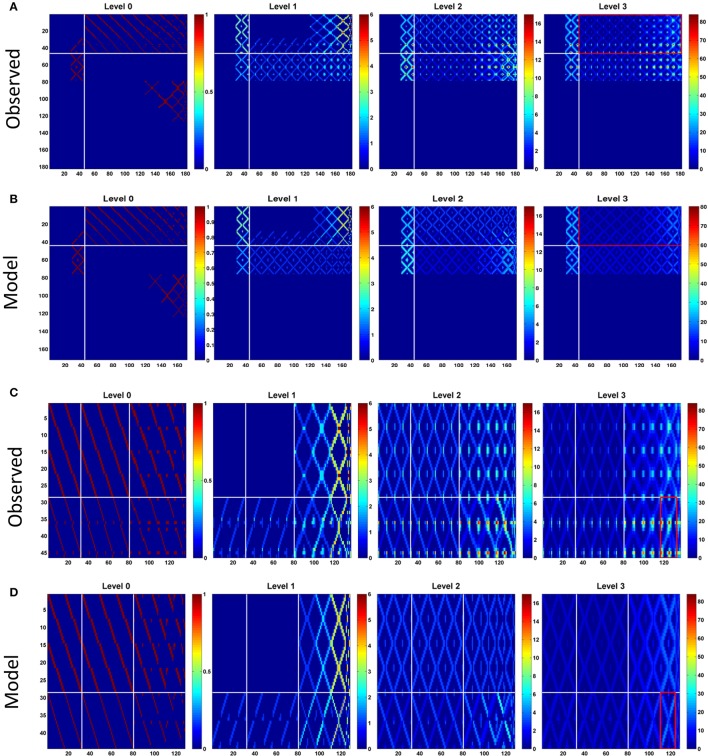
Figure 3.
Connection matrices at different propagation levels for, (A). The observed network and, (B). the model network. The vertical axis represents the index of the source neuron types while the horizontal axis is for the destination neuron types. The order of the neuron type index follows that in Supplementary Table S1 but with local neurons (PB LN) removed. So there are only 184 neuron types presented in the matrices. Each element in the matrices indicates the number of paths (represented by the color) connecting the source and destination neuron types at the given propagation levels. In general, the number of paths increases with the level for both networks as expected. However, the difference between the two networks increases dramatically at the higher levels. The observed network has large maximum path numbers, which is more than twice of that in the model network at the propagation level 3. The white lines separate the PB input neurons (before the lines) from the PB output neurons (after the lines). The red rectangles outline the portion of the matrices shown in (C) for the observed and (D) for the model networks. In (C,D), horizontal white lines separate two classes of input neurons (from top to down: CVP and EIP) and the vertical white lines separate output neuron classes (from left to right: PEI, PEN, PFN, and PFI). The red rectangle marks the region formed by EIP->PFI-IHBI classes, where the largest path number in the observed network is located.

