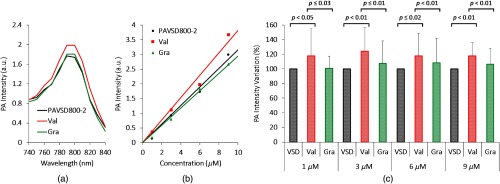
Fig. 7.
(a) PA spectra of the PA-VSD for different concentrations at the prestimulus (black) and stimulated polarized (red) and depolarized (green) states using valinomycin (Val) and gramicidin (Gra). (b) Voltage-dependent PA intensity at 800 nm for different concentrations. (c) PA intensity changes at varying PA-VSD concetrations for polarized (Val, red) and depolarized (Gra, green) states relative to prestimulus (VSD, black). Error bars are standard deviation.

