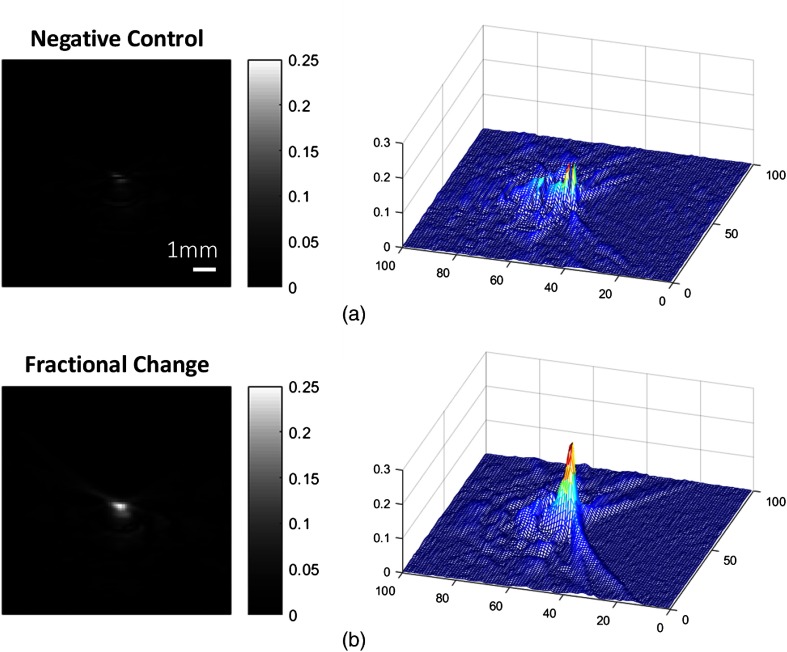
Fig. 9.
Stimulated resting and action state contrast change relative to the prestimulus state intensity. (a) Image produced by subtraction of the gramicidin data from the initial PA dye image is considered a negative control and (b) the difference between the initial PA dye image and the valinomycin-induced polarized state. Magnitude represents the fractional change of the intensity relative to the pre-stimulus state intensity.

