
Figure 1.
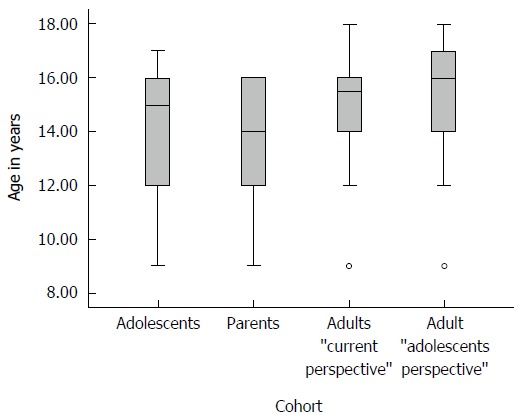
Bo x plots for the suggested starting age of a transition program for each cohort (Answer to the question: “At what age should a transition program start?”). P values were calculated using Mann-Whitney U tests.
Official websites use .gov
A
.gov website belongs to an official
government organization in the United States.
Secure .gov websites use HTTPS
A lock (
) or https:// means you've safely
connected to the .gov website. Share sensitive
information only on official, secure websites.
Bo x plots for the suggested starting age of a transition program for each cohort (Answer to the question: “At what age should a transition program start?”). P values were calculated using Mann-Whitney U tests.