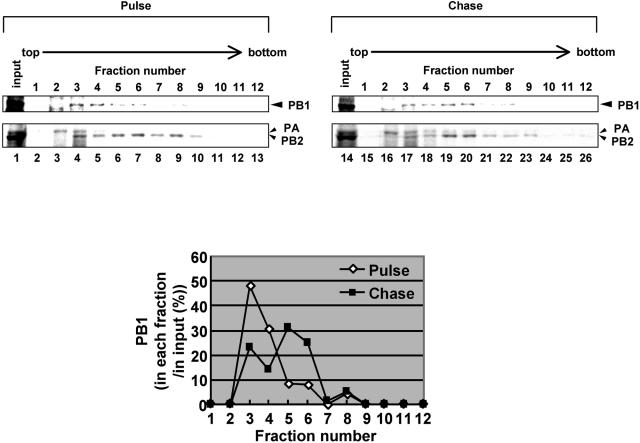
FIG. 6.
Conversion of polymerase complexes. MDCK cells were infected with ts53 virus at an MOI of 10 at 34°C for 4.5 h. Cells were washed and incubated in methionine-free medium for 30 min. Infected cells were then pulse labeled at 34°C for 15 min in the presence of 10 μCi of [35S]methionine and [35S]cysteine mixture/ml. After being washed with MEM, cells were further incubated at 34°C for 15 (pulse) or 60 min (chase) in MEM containing excess amounts of nonlabeled methionine and cysteine. Lysates prepared from metabolically labeled cells were subjected to the glycerol density gradient centrifugation assay as described in the legend to Fig. 5. Upper panel, fractionation of pulse-labeled and pulse-chased polymerases. An aliquot of each fraction was separated in SDS-6% PAGE and then was visualized by autoradiography. PB1, PB2, and PA are indicated by arrowheads. We confirmed that these bands correspond to PB1, PB2, and PA by immunoprecipitation assay using antibodies specific for each polymerase subunit (data not shown). (Lower panel) To determine the amount of PB1 in each fraction, autoradiograms were quantitatively analyzed by the NIH image analyzing system, and the amount of PB1 in each fraction is shown as that relative to the total amount of PB1.

