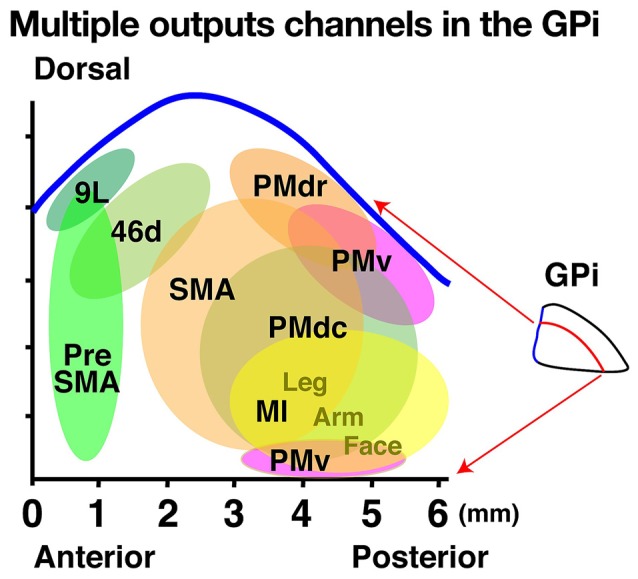
Figure 2.

Multiple output channels in the internal segment of the globus pallidus (GPi) projecting to cortical areas represented on a two-dimensional unfolded map. The horizontal and vertical axes indicate the anteroposterior and dorsoventral axes, respectively. Each colored circle in the map represents the output territory of the GPi confirmed by rabies virus (RV) studies. Tick mark intervals = 1 mm.
