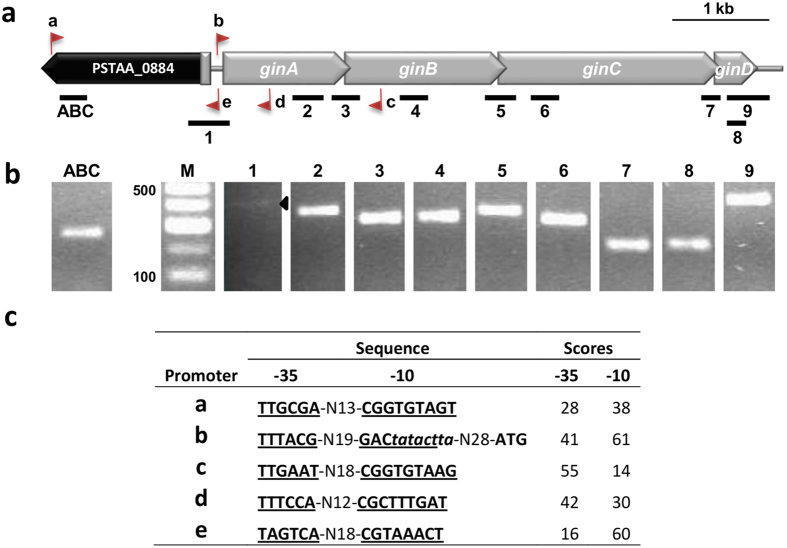
Figure 2. RT-PCR analysis of the gin operon from P. stutzeri DSM 4166.
(a) Location of the amplicons observed in RT-PCR experiments. The location and orientation of promoters predicted using the BPROM software is indicated with flags named from a to e. (b) Gel electrophoresis of amplicons from RT-PCR experiments generated using strand-specific primers for each amplicon for cDNA synthesis, as shown in panel a; the black triangle in lane 1 identifies a repetitively faint amplification band. The RT-PCR negative controls produced no amplicons, and are not shown for clarity. M, molecular weight marker in nt. (c) Sequence and score values of −35 and −10 boxes (underlined) of promoters a to e in panel a, as predicted by the BPROM software. A putative Fis binding box is indicated in italics.

