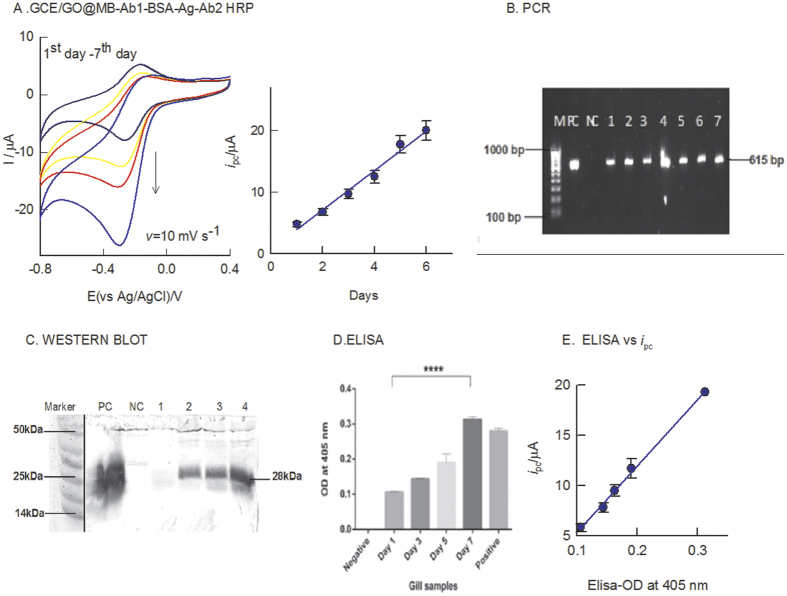
Figure 8. CV response of different days WSSV infected gill tissues (fresh water crabs; Paratelphusa hydrodomous) modified GCE/GO@MB-Ab1-BSA-Ag-Ab2-HRP with 500 μM H2O2 containing pH 7 PBS at v = 10 mV s−1.
Inset is a plot of ipc of H2O2 reduction reaction vs different day samples. (B) PCR of the different day samples analysed. M-100 bp marker, PC- positive control, NC-negative control, 1–7 lanes denote day-1 to day-7 of gill tissue samples. (C) Western Blot of different days’ gill tissue samples. PC-positive control, NC-negative control, 1 = 1st day gill tissue, 2 = 3rd day gill tissue, 3 = 5th day gill tissue & 4 = 7th day gill tissue. (D) ELISA of time course study gill sample. (E) Plot of the optical density of ELISA measured at 405 nm vs peak current (ipc) of the different day sample.

