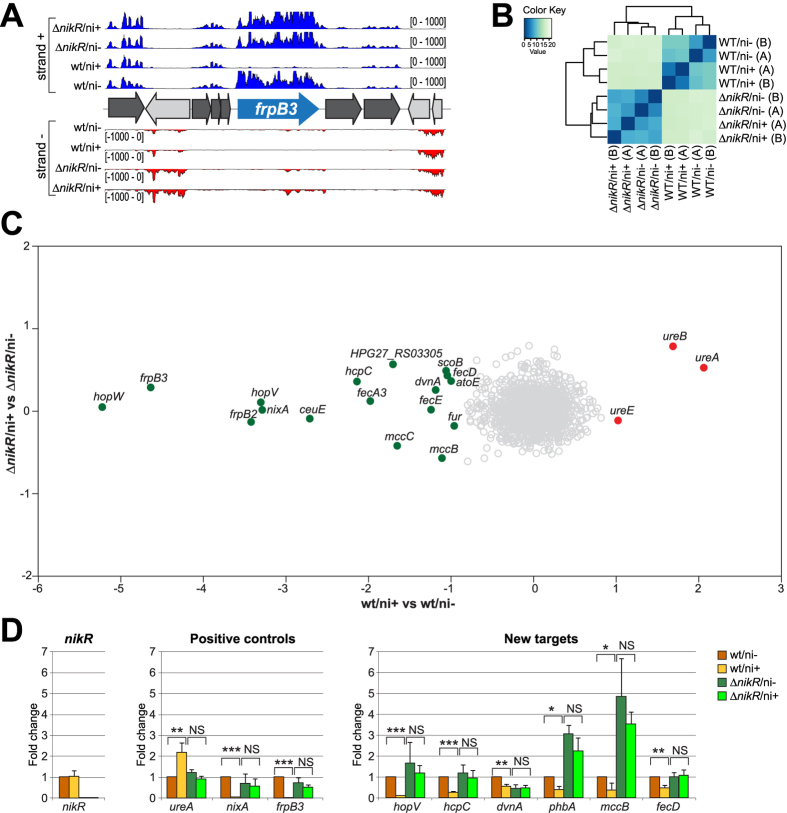
Figure 1. Results of the RNA-sequencing experiment.
(A) RNA-seq profiles of the frpB3 genomic locus: wt/ni+, wt/ni−, ∆nikR/ni+ and ∆nikR/ni− strand specific coverages are shown in blue (strand+) and red (strand−). (B) Heatmap showing the Euclidean distances between samples and replicas as calculated from the regularized log transformation performed by DESeq2 on raw counts. (C) Effect of nickel treatment on H. pylori gene expression: log2FC values of nickel treated (ni+) vs untreated (ni−) samples are reported for wt (x-axis) and ∆nikR (y-axis) genotypes. DEGs induced and repressed after nickel addition are represented as filled red and green circles respectively (log2FC ≥ |1|; adj p < 0.01); empty grey circles correspond to non differential genes. (D) RT-qPCR validation of H. pylori nickel responsive genes expression. nikR (control), ureA, nixA, frpB3 (positive controls) and hopV, hcpC, dvnA, phbA, mccB and fecD (new targets) gene expression levels are reported for wt and ∆nikR strain in both ni+ and ni− conditions. Results show fold changes (mean ± SD) relative to the wt/ni− condition. ΔCts were obtained after normalization on 16S rRNA levels; at least three biological replicates were used for the analysis. SD = standard deviation. Ct = threshold cycle. Statistical significance is calculated using the t-test; *p < 0.05; **p < 0.01; ***p < 0.001.

