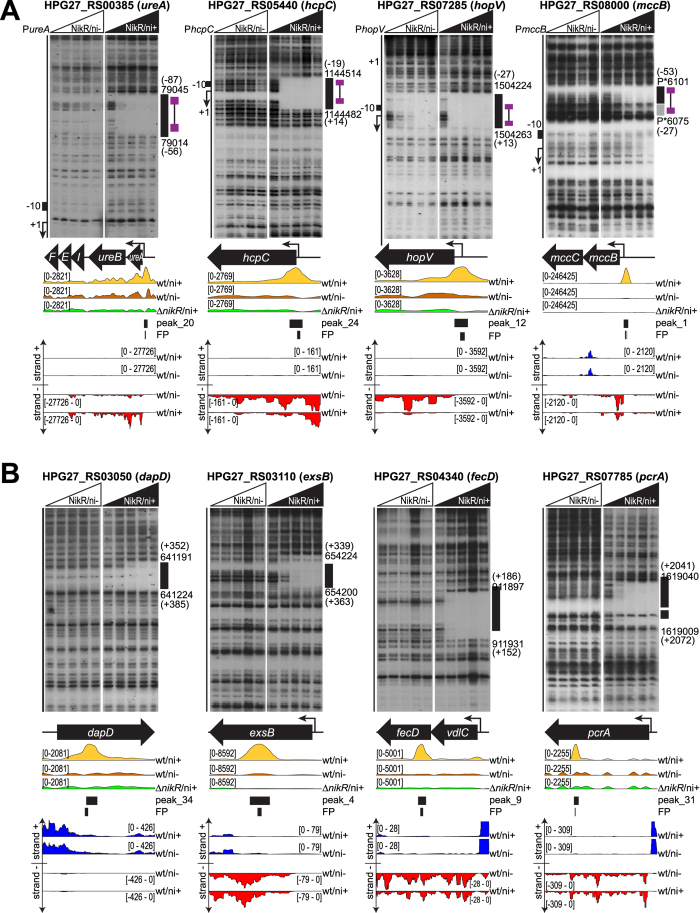
Figure 2. Validation of new NikR promoters and internal peaks by DNase I footprinting.
(A) Radiolabeled PureA, PhcpC, PmccB and PhopV DNA probes were mixed with 0, 9.7, 29, 97 and 290 nM of the NikR tetramer, without nickel (left side of each panel) or with the addition of 150 μM NiSO4 (right side of each panel), before DNase I cleavage. On the right of each autoradiographic film, the G27 genomic coordinates of DNase I protected regions (black boxes) are reported, with position in brackets with respect to the transcriptional start site (TSS). Low affinity binding sites, if present, are shown as grey boxes surrounded by the same information. On the left, a schematic representation of the promoter is provided, with the TSS (+1, bent arrow) and the −10 region (black box). The position of the consensus sequence is reported with violet boxes, corresponding to the two conserved hemi-operator pentamers linked by a black line (15 nt spacer). In the middle panels a scheme of the corresponding transcriptional unit is shown, together with the normalized tag densities obtained from the ChIP-seq experiments (wt/ni+ in yellow, wt/ni− in orange and ∆nikR/ni+, negative control in green), the predicted peak extension by Homer2 and the DNaseI protected regions. Representation scales of ChIP-seq tracks are indicated on the left in brackets. In the bottom panels, the RNA-seq strand specific tracks of the corresponding genomic locus are visualized for wt/ni+ and wt/ni− samples (plus strand in blue, minus strand in red). P* indicates coordinates mapping on the pHPG27 plasmid. (B) Radiolabeled dapD, exsB, fecD and pcrA DNA probes were mixed with 0, 9.7, 29, 97 and 290 nM of NikR tetramers, without nickel (left side of each panel) or with the addition of 150 μM NiSO4 (right side of each panel). The same elements and information are reported as in panel A.

