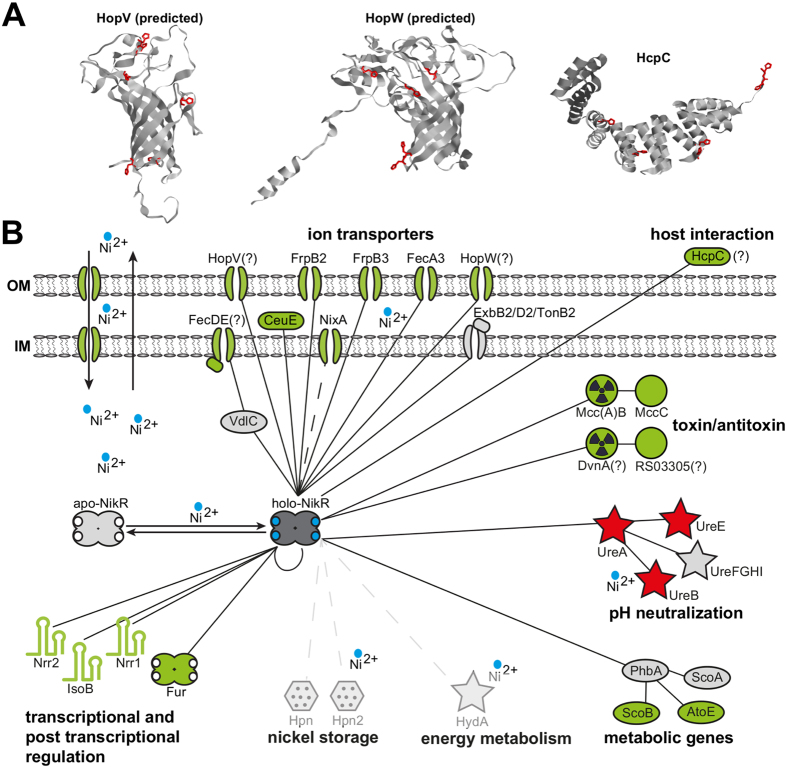
Figure 5. Model of the NikR regulon.
(A) Predicted structures of HopV and HopW proteins, computed by the online tool Phyre2 and deposited crystallographic structure of the HcpC protein (PDB 1OUV). Histidine residues are highlighted in red. (B) The network connects NikR to the first gene of each transcriptional unit (TU) under direct (validated by footprinting) transcriptional control. Filled lines indicate interactions verified in this study, while dotted lines denote uncertain interactions. Genes part of the same TU are linked to the first gene of the cistron, with red, green and grey colours symbolizing induction, repression or absence of NikR-dependent regulation, respectively. Symbols are related to the predicted biological function.

