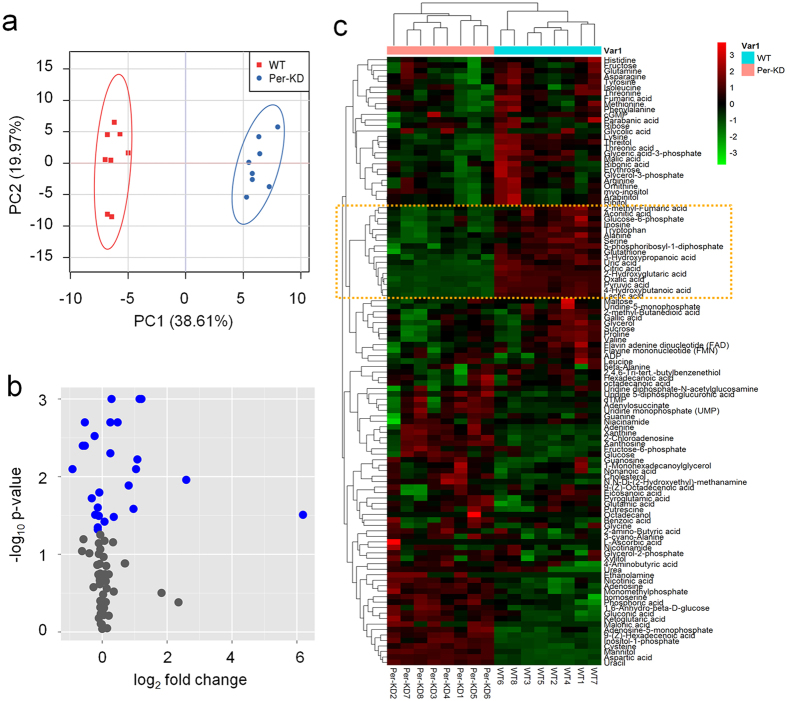
Figure 3. LC/GC-MS assay based metabolomics.
PCA (a), volcano plot (b), and heat map (c). In the volcano plot, differential metabolites (blue) and non-differential substances (gray) were screened out under the conditions of fold change ≥1 and p ≤ 0.05. WT, wild-type BmN cells; Per-KD, BmPer knockdown BmN cells. WT 1–8 and Per-KD 1–8 on the x axis in (c) indicate eight repeated assays.

