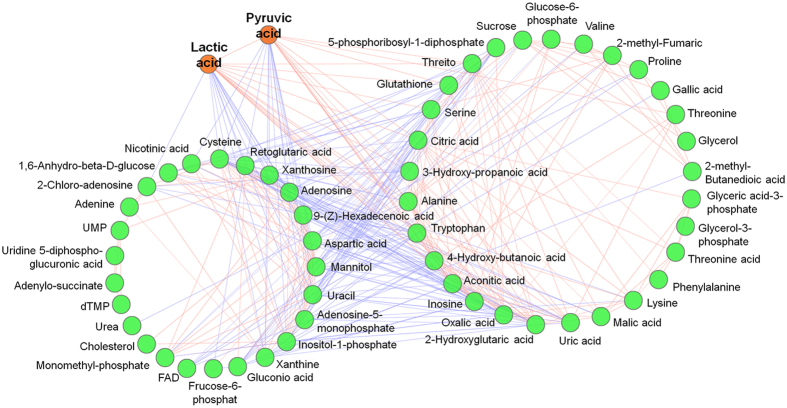
Figure 4. Correlation network diagram of differential metabolites.
Metabolite correlation analysis was carried out using Pearson’s correlation coefficient, with the cor() function in the R language package (www.r-project.org). The Pearson’s correlation coefficient threshold was set as 0.8. Red lines represent positive correlations between substances, blue lines represent negative correlations between substances.

