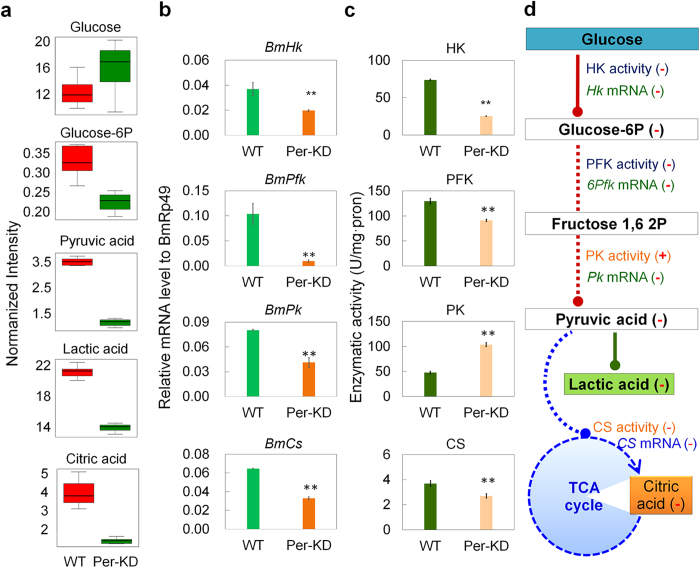
Figure 6. Effect of BmPer gene knockdown on glucose metabolism in BmN cells.
(a) Changes in contents of main substrates and products, based on metabolomic measurements. (b) Transcription levels of the main rate-limiting enzyme-encoding genes. (c) Activities of the main rate-limiting enzymes. (d) Main affected glucose metabolic pathways. Per-KD, BmPer knockdown BmN cells; WT, wild-type BmN cells; HK, hexokinase; PFK, phosphofructokinase; PK, pyruvate kinase; CS, citrate synthase; +, increased enzymatic activity; −, decreased content or enzyme activity, or down-regulated transcription of coding gene. *p ≤ 0.05 and **p ≤ 0.01.

