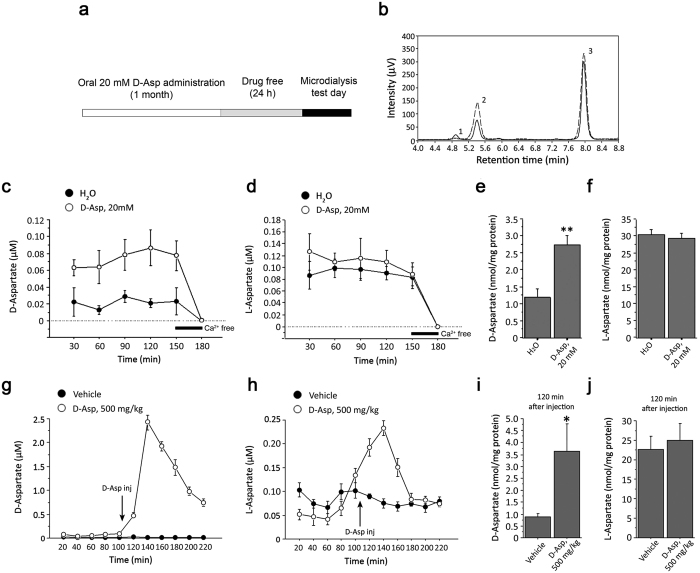
Figure 1. D-aspartate extracellular concentration in the mouse prefrontal cortex increases after chronic and acute administration of the D-amino acid.
(a) Schematic timeline of the oral chronic D-aspartate administration procedure and microdialysis. (b) Examples of HPLC chromatograms illustrating the detection of D-Asp (1), L-Asp (2) and L-Glu (3) in a perfusate collected from the prefrontal cortex (PFC) of a mouse subjected to 20 mM D-Asp treatment. Retention times: D-Asp = 4.8 ± 0.1 min; L-Asp = 5.5 ± 0.1 min, L-Glu = 8.0 ± 0.2 (mean vaues ± SD; n = 10). The identity of D-Asp peak and the peak area was determined by analyzing the sample upon a pre-column treatment with beef DDO (grey dashed line). (c,d) Time course of extracellular concentration of free (c) D-Asp and (d) L-Asp in the PFC of mice chronically treated with 20 mM D-Asp and in their untreated controls (n = 5 per treatment). Last fraction of dialysates (150–180 min) was collected in a Ca2+-free ACSF. (e) Free D-Asp and (f) L-Asp total contents in PFC homogenates of chronically treated mice and controls (n = 4 per treatment). (g,h) Time course of extracellular concentration of free (g) D-Asp and (h) L-Asp in the PFC of mice subjected to the acute i.p. administration of 500 mg/kg D-Asp and in vehicle-treated animals (n = 5 per treatment). (i) Free D-Asp and (j) L-Asp total contents in PFC homogenates of acutely D-Asp-treated mice, after 2 h from treatment, and in vehicle-treated controls (n = 4 per treatment). The amount of free D-Asp and L-Asp in tissue homogenates was normalized by the total protein content of each sample. The graphs display the mean values ± SEM. *P < 0.05, compared to vehicle-treated mice; **P < 0.01, compared to untreated mice (Student’s t test).

