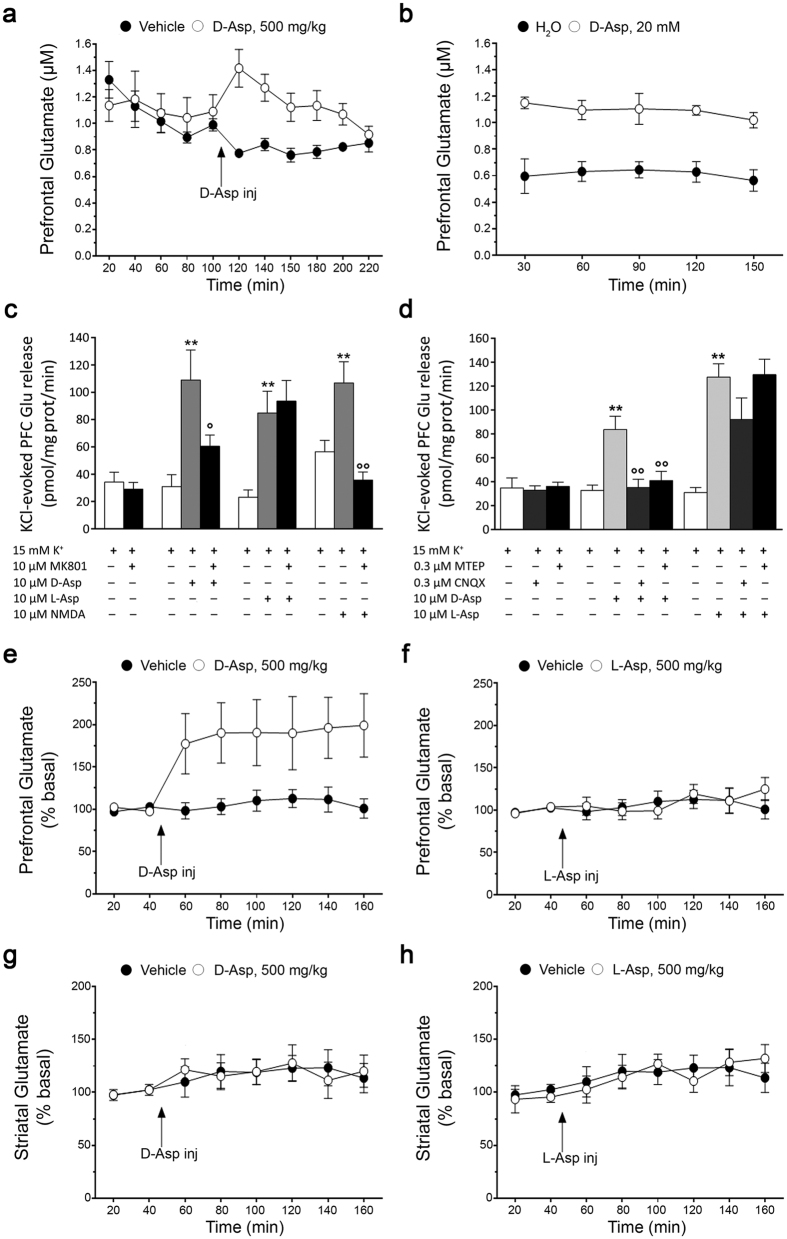
Figure 2. D-aspartate administration stimulates extracellular L-glutamate efflux through presynaptic NMDA and non-NMDA ionotropic and metabotropic receptors.
(a,b) Time course of extracellular L-Glu levels in the prefrontal cortex (PFC) of mice (a) subjected to the acute administration of 500 mg/kg D-Asp or (b) chronically treated with 20 mM D-Asp, and their respective controls (n = 5 per treatment). The graphs displayed the mean values ± SEM. (c,d) Detection of KCl-evoked extracellular L-Glu release from cerebrocortical synaptosomes. Synaptosomes were continuously perfused with a medium containing the excitatory amino acids transporter inhibitor TBOA (10 μM), and stimulated with 15 mM K+ for 90 sec. D-Asp, L-Asp and NMDA (10 μM) were added 3 min prior K+ and maintained for further 3 min. (c) MK801, (d) MTEP or CNQX were added 3 min before agonists and maintained until the end of experiment. Data represent net extra release (i.e. release above baseline), and are expressed as mean ± SEM pmol/mg prot/min of the following numbers of determinations: (c) n = 8–10 (K+), n = 12–13 (D-Asp), n = 11–15 (L-Asp), n = 5–7 (NMDA); (d) n = 8–9 (K+), n = 12–18 (D-Asp), n = 9–12 (L-Asp). **P < 0.01, compared to K+ alone; °P < 0.05, °°P < 0.01, compared to K+ in the presence of agonist (one-way ANOVA followed by the Newman-Keuls test for multiple comparisons). (e–h) Time course of extracellular L-Glu levels in the (e,f) PFC (n = 12 vehicle, n = 9 D-Asp, n = 10 L-Asp) and (g,h) striatum (n = 9 vehicle, n = 11 D-Asp, n = 9 L-Asp) of mice after acute administration of (e,g) 500 mg/kg D-Asp or (f,h) 500 mg/kg L-Asp. The graphs display the mean values ± SEM.

