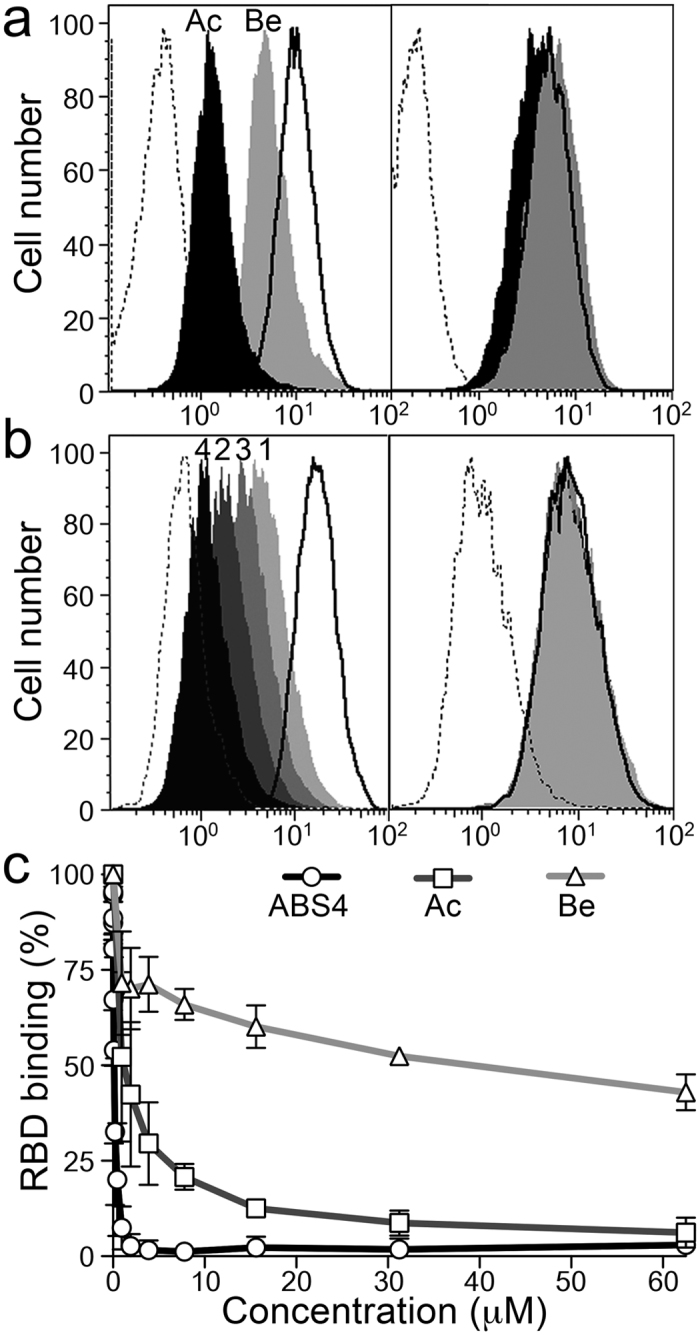
Figure 4. Drugs that bind the catalytic site inhibit CoV binding to APN.

(a,b) Flow cytometry to monitor TGEV RBD-Fc protein (~1 μg/ml) binding to CHO cells expressing pAPN (left panels) or a pAPN catalytic mutant (right panels). The mutant (pAPN-HH/AA) lacks the two histidines that coordinate the zinc ion (Supplementary Fig. S2). Histograms recorded with the RBD-Fc protein alone (solid line histograms) or with pAPN active site-binding drugs (filled histograms) are shown. Control unrelated Fc fusion protein, dashed line histogram. Overlay plots of histograms for samples alone or with 500 μM bestatin (Be; gray) or actinonin (Ac; black) in (a); samples with synthetic APN-binding drugs ABS1, 3, 2, and 4 (light gray to black; as numbered) in (b). Approximate pAPN Ki values for bestatin and actinonin are 4 and 1 μM29, respectively, and 40, 7, 19 and 0.06 nM for ABS compounds 1 to 430. Described in Supplementary Fig. S3a. (c) Relative RBD-Fc binding to pAPN-expressing BHK cells, alone or with increasing concentrations of bestatin, actinonin and ABS4. Mean fluorescence intensity computed by flow cytometry was used to calculate RBD binding ratios (see Methods). Mean ± SD (n ≥ 3).
