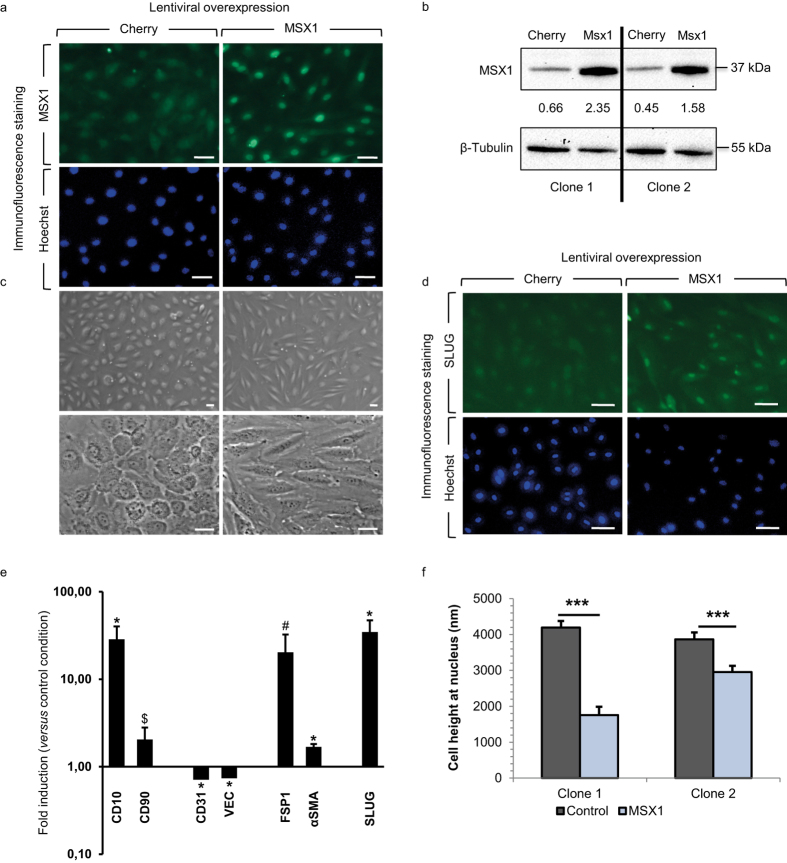
Figure 2. Overexpression of MSX1 causes elongation and flattening of HUAECs.
(a) Nuclear expression of MSX1 (green) in HUAECs after lentiviral transduction with MSX1- or Cherry-encoding reporter viruses. Hoechst (blue) was used as a nuclear marker. (b) Western blot and corresponding densitometric quantification (normalised for ß-tubulin as loading control) showing MSX1 protein overexpression in 2 clones (see Supplementary Fig. S5 for full-length blots). (c) Phase contrast pictures showing the phenotypic change from cobblestone-like to spindle-like shape upon overexpression of MSX1. (d) Immunofluorescence staining for mesenchymal transcription factor Slug (green) and nuclear marker Hoechst (blue). An induction of Slug is observed in MSX1-overexpressing cells. Scale bars in (a,c,d): 25 μm. (e) Gene expression analysis by qRT-PCR. It shows a down-modulation of endothelial markers and induction of stem cell and mesenchymal markers. mRNA expression levels upon MSX1 overexpression are represented as fold induction versus control condition, in ‘n’ independent experiments, n = 7 for CD90, FSP1; n = 8 for CD31, SLUG, VEC; n = 9 for αSMA, CD10. Error bars represent the standard error of the mean (s.e.m.), #P = 0.07, $P = 0.1, *P < 0.05 by one sample Student’s t-test with null-hypothesis 1. (f) Height of the cells measured in two independent clones on the nuclear region by indentation with colloids using AFM with FluidFM add-on technology. MSX1-overexpressing cells are thinner than Cherry control cells. Error bars represent s.e.m. of the total amount of cells measured per condition (n). ***P = 7∙10−10 in clone 1 and ***P = 0.0008 in clone 2 by Student’s t-test, n = 20, 18, 36 and 37, with ‘n’ representing the number of indented cells for control and MSX1 conditions for clone 1 and 2, respectively.

