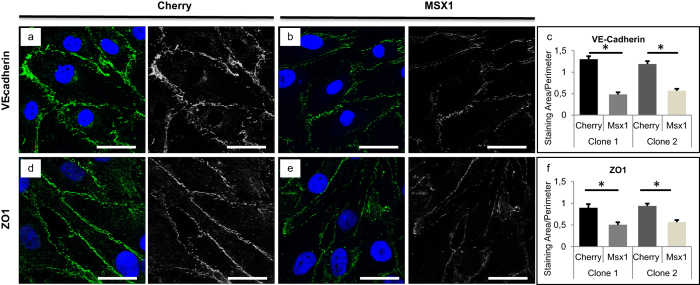
Figure 3. Disassembly of cell-cell contacts upon upregulation of MSX1 in a HUAEC monolayer.
(a–c) Immunofluorescence staining on HUAECs transduced with Cherry- (a; control) or MSX1-encoding (b) lentivirus for the adherens junction marker VEC (green) and nuclear marker TO-PRO-3 (blue) and the corresponding quantification in (c). A reduced expression of VEC is observed in MSX1-overexpressing cells. Data in (c) are expressed as mean area (in μm2) per cell perimeter (in μm) ± s.e.m. of the total number of measured cells (n = 16 for all conditions; *P < 0.05 versus corresponding control by Student’s t-test). (d–f) Staining of Zonula Occludens-1 (ZO1; green) and nuclear marker TO-PRO-3 (blue). MSX1-overexpressing cells (e) show a reduction of ZO1 expression as compared to control cells (d). Panel (f) shows the corresponding quantification in which data are expressed as mean area of positive ZO1 signal (in μm2) per cell perimeter (in μm) ± s.e.m. of the total number of measured cells (n = 16 for all conditions; *P < 0.05 versus corresponding control by Student’s t-test). Scale bars: 25 μm.

