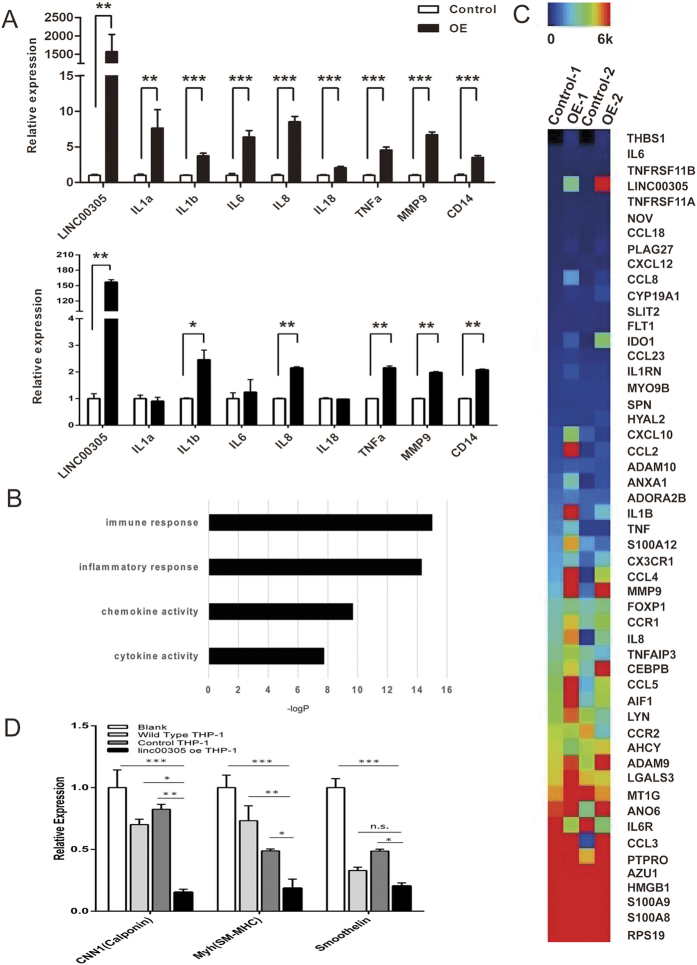
Figure 3. LINC00305 promotes inflammation in THP-1 cells and phenotype switching in co-cultured HASMCs.
(A) QRT-PCR analysis of pro-inflammatory gene expression in THP-1 cells stably expressing LINC00305 (OE) or the control vector (Control). The upper and lower panels show different levels of LINC00305 overexpression. Gene expression levels in the control groups were assigned a value of 1.0, and GAPDH was used as an internal control. Data are presented as the mean ± sem of 3 independent experiments. (B,C) GO analysis and heat map of the microarray data demonstrated upregulation of inflammation-associated genes in LINC00305-overexpressing THP-1 cells. The gene expression profiles of THP-1 cells stably expressing LINC00305 and the control cells were examined using microarray analysis (Affymetrix, Human Exon 1.0 ST array). Genes upregulated in cells overexpressing LINC00305 were analysed by GO enrichment analysis (B) and the genes involved in inflammation, monocyte activation and chemotaxis (GO:002544, 002548, 0042177, 0090025) were analyzed with MeV software to show the heat map of the inflammation-relevant genes in the microarray assay (C). (D) QRT-PCR analysis of contractile markers in untreated HASMCs (blank) and in HASMCs co-cultured with wild type THP-1 cells, THP-1 cells stably expressing LINC00305 (Linc00305 oe THP-1) or the control vector (Control THP-1). The relative mRNA expression levels were normalized to the GAPDH internal control. The genes expression levels in the Blank group were assigned a value of 1.0. Data are presented as the mean ± sem of 3 replicate experiments. *p < 0.05, **p < 0.01, ***p < 0.001 vs. the indicated group.

