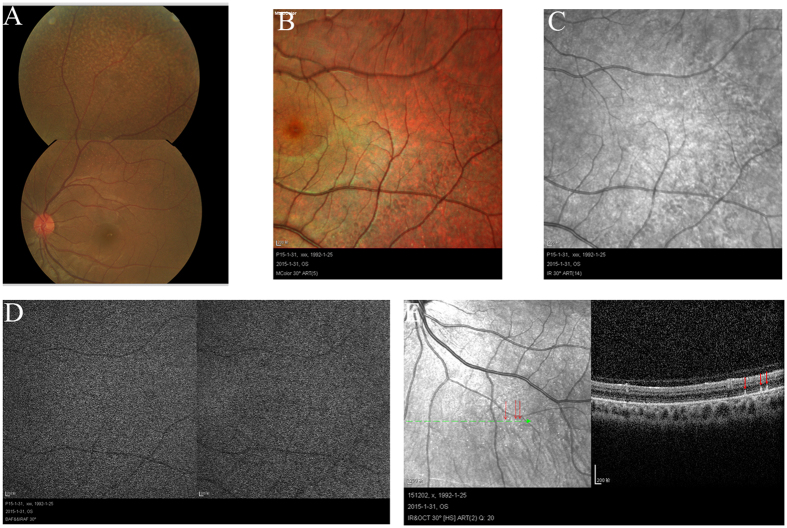
Figure 3. Fundus imaging of II:2 in family 2.
Fundus photograph (A) and multicolor (B) showed lots of white-yellow dots in the periphery of the retina. IR (C) showed the dots in areas corresponding to fundus photograph. FAF (D) showed the normal image. OCT (E) showed the hyperreflective lesions (arrows) in areas corresponding to dots (arrows) in the periphery of the retina. Abbreviations: IR. infrared reflectance; FAF. fundus autofluorescence; OCT. optical coherence tomography.

