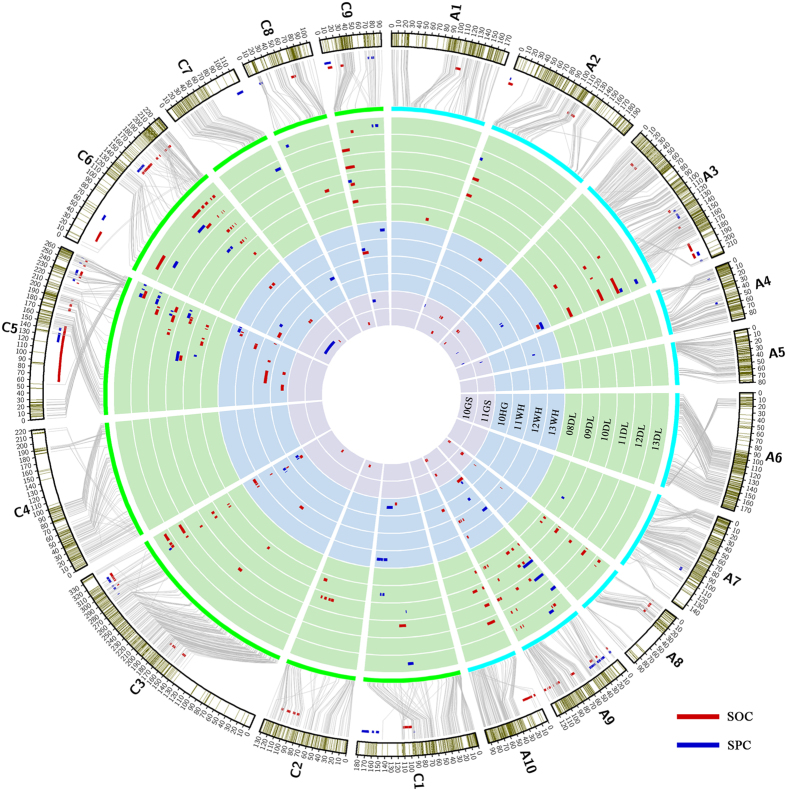
Figure 1. KN high-density genetic linkage map, distribution of markers, identified QTLs, consensus QTLs of SOC and SPC on each linkage group, and colinearity of the linkage map and B. napus reference genome.
The blocks with green bands at the outermost circle represent the 19 genetic linkage groups and the marker distribution. The third circle (from the outermost one) represents the 19 chromosomes of B. napus. The lines connecting them represent their col-linearity relationship. The 12 inner circles with 3 colors represent 12 microenvironments in winter-type, spring-type and semi winter-type rapeseed growing areas, respectively. The short bars with a red and blue color within the 12 inner circles represent QTLs identified in different environments and linkage groups, and they are located between the outermost two circles representing consensus QTLs.

